Heparin has been utilized as a clinical anticoagulant for more than seventy years. However, this molecule has come under scrutiny due to contamination of certain pharmaceutical lots by chondroitin sulfate. Complete characterization using advanced techniques is required to identify the specific chemical composition of heparin lots.
Measurement of electrophoretic mobility facilitates determining the average molecular charge. In conjunction with the molecular weight, the net charge can be utilized to differentiate heparin lots contaminated with super-sulfated molecules. Discrimination is achieved by means of the ratio of molar mass to molecular charge. Molar mass is determined by SEC-MALS and molecular charge by means of electrophoretic light scattering.
Sample Preparation and Instrumentation
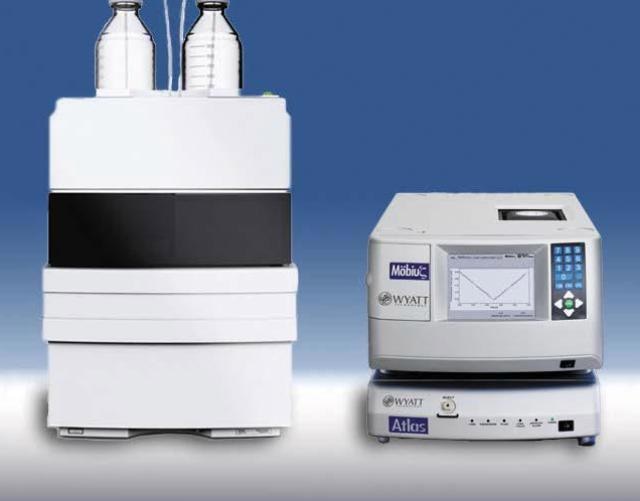
Heparin samples were dissolved in 0.1M ammonium acetate to a final concentration of ~5mg/mL and then allowed to equilibrate at room temperature before starting analyses. Electrophoretic light scattering (MP-PALS) analysis was performed with the Wyatt Möbiuζ. Samples were filtered to 0.02µm and injected directly into the Möbiuζ flow cell. Electrophoretic mobility was measured simultaneously with hydro-dynamic radius by dynamic light scattering (DLS). The instrumentation used for the analysis is shown in Figure 1.
SEC-MALS was used to determine molar mass and polydispersity of fractionated and unfractionated heparin samples. Unfiltered samples were loaded onto a chromatography column, and the molar mass of the eluting sample was measured using a DAWN HELEOS MALS detector and Optilab rEX refractive index detector.

Figure 1. Instrumentation - Möbiuζ and Atlas accessory.
Experimental Results
Although slight differences were observed in the molar mass of the unfractionated heparin samples, this variation was not sufficient for concluding whether a given lot of heparin was contaminated with super-sulfated material (Table 1). It is also difficult to differentiate the hydrodynamic radius of the pure heparin from the sample contaminated with super-sulfated material.
Table 1. Weight-average molar mass and z-average hydrodynamic radius of unfractionated heparin samples.
| |
MW (kDa) |
rh (nm) |
| Unfractionated Heparin, Supplier 1 |
15.9 + 0.1 |
2.30 + 0.02 |
| Unfractionated Heparin, Supplier 2 |
18.8 + 0.3 |
2.48 + 0.01 |
| Super-sulfated Heparin, Supplier 2 |
17.9 + 0.0 |
2.49 + 0.02 |
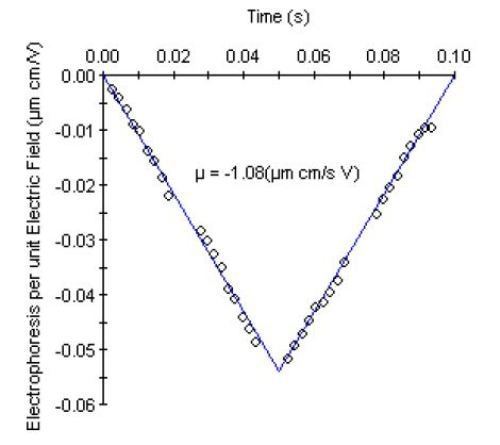
Since the negative charge on the sample was expected to increase in the presence of super-sulfated material, electrophoretic mobility measurements were performed to determine if net charge could be used to differentiate pure heparin and from contaminated samples. A characteristic ‘V-graph’ for the electrophoretic mobility measurement is shown in Figure 2. The data represents the average of 300 electric field oscillations multiplexed across 30 detectors.

Figure 2. Electrophoretic mobility data for unfractionated heparin from Supplier 1.
The negative electrophoretic mobility (µ) results from the negative net charge for the heparin sample. The net charge and zeta potential are then determined from the electrophoretic mobility and hydrodynamic radius. Table 2 summarizes these parameters for the unfractionated heparin samples and fractionated heparin standards (NHP).
Table 2. Mobility, effective charge, zeta potential, hydrodynamic radius for unfractionated heparin samples and fractionated standards.
| |
Mobility ((µm*cm)/(s*V)) |
Effective charge (Z*) |
Zeta Potential (mV) |
rH(nm) |
| Unfractionated Heparin, Supplier 1 |
-1.00 ± 0.05 |
-7.1 ± 0.40 |
-16.9 ± 0.9 |
2.30 ± 0.02 |
| Unfractionated Heparin, Supplier 2 |
-1.18 ± 0.09 |
-9.3 ± 0.64 |
-19.5 ± 1.5 |
2.48 ± 0.01 |
| Super-sulfated Heparin, Supplier 2 |
-1.46 ± 0.12 |
-11.2 ± 0.96 |
-23.8 ± 1.9 |
2.49 ± 0.02 |
| NHP III |
-0.42 ± 0.03 |
-3.2 ± 0.26 |
-7.9 ± 0.57 |
2.19 ± 0.02 |
| NHP IV |
-0.65 ± 0.10 |
-4.2 ± 0.56 |
-11.8 ± 1.7 |
2.09 ± 0.02 |
| NHP VI |
-0.86 ± 0.05 |
-7.1 ± 0.39 |
-15.8 ± 0.9 |
2.43 ± 0.02 |
| NHP VII |
-0.85 ± 0.10 |
-14.2 ± 1.8 |
-14.2 ± 1.7 |
3.74 ± 0.03 |
As predicted, the super-sulfated material demonstrated the largest net charge among the three unfractionated heparin samples. Nevertheless, the deviation in charge between the pure and super-sulfated samples was of the same magnitude as the deviation in charge for the two suppliers. The deviation might only reveal the difference in molar mass or polydispersity, thereby suggesting that net charge alone is not enough to qualify different lots of heparin.
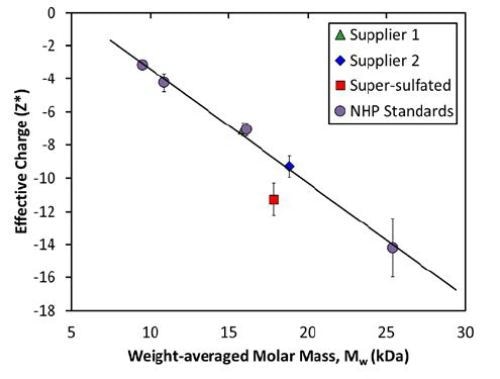
However, the pure heparin samples can be clearly differentiated from the super-sulfated samples when both charge and mass are considered together (Figure 3). A calibration curve for pure heparin was generated using the molar mass and net charge of the fractionated heparin standards (NHP III, IV, VI, and VII). These four samples create a linear relationship between net charge and molar mass for pure heparin, representing a constant charge:mass ratio.

Figure 3. Measured net charge and molar mass for heparin standards exhibits a linear relationship, indicating a constant charge:mass ratio.
On the basis of their measured MW, the net charges for unfractionated heparin from Suppliers 1 and 2 are in the range of 2% of the expected value. Conversely, the measured net charge of the super-sulfated heparin from Supplier 2 is roughly 30% higher than the expected value for a heparin of that size.
Conclusion
From these results, it is evident that effective molecular charge can be characterized rapidly and non-destructively through simultaneous measurements of electrophoretic mobility and hydrodynamic radius. The increase in negative charge, as quantified by a change in electrophoretic mobility, is constant with an increase in sulfate groups in the modified heparin sample.
Combining the measured molar mass and measured charge for each heparin sample yields a characteristic fingerprint for pure heparin when compared to contaminated samples. The clear discrimination in the effective charge:mass ratio between unmodified and super-sulfated heparin means this value may be used as a metric for qualifying different heparin samples.
Reference
Adapted from "Discriminating Heparin from Chondroitin Sulfate by Charge: Mass Ratio," white paper by Sophia Kenrick, Ph.D. Graphs and illustrations reprinted with permission from Wyatt Technology.

This information has been sourced, reviewed and adapted from materials provided by Wyatt Technology.
For more information on this source, please visit Wyatt Technology.