Epoxy thermoset resins are a class of industrial polymers that are used in applications where three-dimensional shapes are molded using compression and injection extrusion methods. When compared to other similar materials, these resins offer a number of benefits such as excellent adhesion to substrates and excellent electrical and mechanical properties.
In the curing process, the polymeric material is permanently hardened to its final shape. In order to ensure that the properties of the end product satisfy the structural, thermal, and electrical properties needed for the product’s proposed application, effective monitoring is very important.
Spectral Differential Scanning Calorimetry
Spectral Differential Scanning Calorimetry (DSC) is a technique that refers to the combined method of DSC with Raman or near-infrared (NIR) spectroscopy. This method provides heat-flow as well as structural and chemical information concurrently for materials that experience solid-phase transitions induced thermally.
Vibrational spectroscopy can also provide data related to the structural or chemical changes that take place in the material, and this data supplements the heat-flow information determined by the DSC technique. This article describes the measurement of the curing process of an epoxy thermoset resin using both chemical-structural and thermodynamic information achieved through the combined method of DSC and Raman spectroscopy.
Experimental Procedure
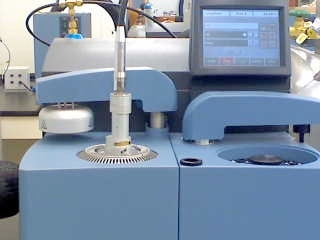
In this experiment, a two-part epoxy containing a hardener and a resin was utilized. TA Instruments’ Q2000 differential scanning calorimeter equipped with an RCS90 refrigerated cooling system was used to obtain the DSC information. Next, a Universal Optical Accessory interface from TA Instruments was used to support and position the Raman fiber-optic probe, TA- DSC-Probe-785, over the sample in the DSC, as shown in Figure 1.

Figure 1. DSC-optimized Raman probe interfaced to the Q2000 DSC.
In order to realize improved signal strength, an integrated thumbwheel drive was utilized to adjust the height of the Raman probe. Featuring a 5m-cable length, the Raman probe allows the base portion of the Raman analyzer to be placed at an easy-to-access location on the lab bench.
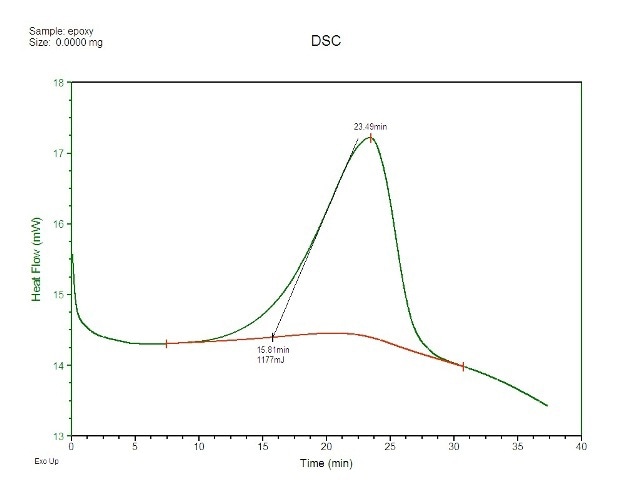
Next, equal quantities of hardener and resin were combined and a small fraction of this mixture was placed on the middle of a DSC pan sans a lid. The experiment has to be performed in an open-pan mode because the light had to interact with the sample being studied. The pan was subsequently placed in the DSC, and a procedure was performed which initially equilibrated the cell at -25°C and then increased the temperature to 50°C at a speed of 2°C per minute. Figure 2 shows the DSC results of plotted vs. time. The peak has been incorporated so as to determine the heat which occurred at the time of reaction.

Figure 2. Cure exotherm for epoxy as captured by DSC.
Then, by means of the DSC-optimized Raman probe, Raman information was obtained with Kaiser Kaiser Optical Systems’ RamanRxn1™ analyzer. The Raman system had 150 to 3425cm-1 spectral range with ~70mW laser emission from an Invictus™ 785nm diode laser.
During operation, the analyzer’s shutter was removed because the sample may otherwise be subjected to oscillatory laser-heating that is commonly seen in other systems and further makes the experiment and the corresponding experimental determinations more complicated.
Results and Discussion
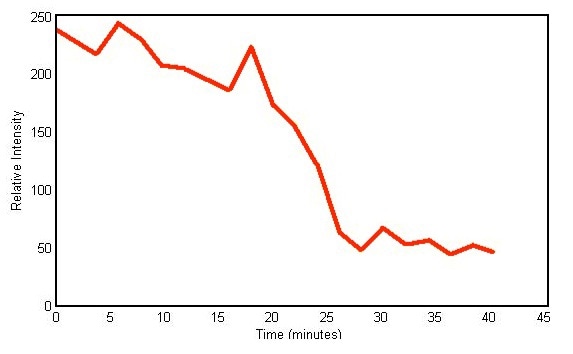
Every two minutes, the RamanRxn1™ analyzer collected data, and each ensuing spectrum was an average of three accretions. Generally, when spectral data are studied, it is usual to search for shifts in peak intensities or peak positions. During the experiment, as the cure advanced, the intensity of the peak centered at 2577cm-1 reduced considerably.
The resin is a combination of bisphenol-A and epichlorohydrin, while the hardener is a proprietary substance whose chemical nature is a mixture of amine and thiol. Thiols are organosulfur compounds that include a sulfur and hydrogen bond. Raman peaks from 2560 to 2590cm-1 are attributed to the stretching vibration of this sulfur– hydrogen bond.
Therefore, it can be safely concluded that the shifts in the 2577cm-1 peak track the chemical conversion of hardener owing to the curing process. Figure 3 shows a plot of the peak height against time of the 2577cm-1 peak amplitude and substantiates the decline in amplitude.

Figure 3. Plot of peak height versus time of Raman peak centered at 2577cm- 1
These results show that real-time Raman spectroscopy can be employed to track the curing process in a two-part epoxy and can even be utilized to study the particular chemical process involved.
Conclusion
The above data shows the efficacy of the spectral DSC technique for studying the thermo-chemical processes involved in the curing process of a simple two-part epoxy system. The DSC data offer the required information on the heat evolved during the reaction and hence can be utilized to ascertain percent cure, whilst the Raman data helps in studying the nature of the chemical conversion.
Raman spectroscopy allows for greater specificity of chemical data when compared to those obtained from NIR spectroscopy. This is because the former is susceptible to the chemical nature of the hardener. Thus, the combined application of spectroscopic and thermal analysis provides a suitable platform to gain a better understanding of industrial thermosetting procedures.
About Kaiser Optical Systems
Kaiser Optical Systems, Inc. is a world leader in spectrographic instrumentation and applied holographic technology. Principal products include Raman sensors and instrumentation, advanced holographic components for spectroscopy, and astronomy and ultra-fast sciences. Principal offices and the manufacturing facility are located in Ann Arbor, Michigan.
Their products and services are deployed throughout the world in such diverse applications as pharmaceutical and chemical manufacturing, nanotechnology, telecommunications, education, forensic science, deep-sea exploration, and astronomy. From particles smaller than a human hair to objects as large as planets, their products are providing our customers unique insights into both today’s as well as “age-old” questions.
Kaiser was founded in 1979 to meet the need for diffractive or holographic optics for the avionics market. Kaiser entered the spectroscopy market in 1990 with the introduction of the holographic notch filter. In 1993 Kaiser released their first Raman analyzer, the HoloProbe. In 2013, the company became part of the Endress+Hauser Group.
To better serve the European community, Kaiser opened a new subsidiary in Europe in 1998. Kaiser Optical Systems SARL is located in Lyon, France. Kaiser SARL supervises their distributor network within Europe.

This information has been sourced, reviewed and adapted from materials provided by Kaiser Optical Systems.
For more information on this source, please visit Kaiser Optical Systems.