Heat stabilizers for PVC are synthesized from precursors such as methyltin chlorides, including dimethyltin dichloride ((CH3)2SnCl2) and methyltin trichloride (CH3SnCl3). Measuring the proportions of these components in PVC products is a critical QA/QC process.
Traditionally, at-line gas chromatography (GC) has been used for this purpose, but requires a laborious sampling technique to avoid human exposure to the highly toxic organotin compounds. This problem can be addressed by Raman spectroscopy, which can perform real-time, in-line analysis using a remotely operated system coupled to an insertion probe.
In addition, Raman spectra reveal molecular structure and functional groups compared to the data obtained by GC, which yields only one band for a single analyte.
Experimental Procedure
Kaiser Optical Systems’ HoloProbe™ analyzer (current version is RamanRxn3™ Analyzer) was used to acquire the Raman spectra using a 785-nm excitation wavelength. In this experiment, mixtures of dimethyltin dichloride and methyltin trichloride were the samples examined in the liquid phase subsequent to melting in an oven.
Sampling was done using the immersion probe, which was able to survive the corrosive environment of methyltin chlorides as its wetted parts were made of alloy C-276 and sapphire. The GRAMS® software package was used to truncate the Raman spectra to the analytically useful range, (300–650 cm-1) prior to the subsequent analysis.
In each spectrum, a fifth-order polynomial was used to fit the curved fluorescence baseline, which was subsequently subtracted. The next step was the re-zeroing of the new corrected baseline.
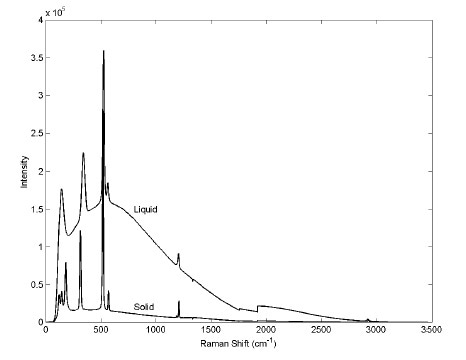
Raman spectra were acquired for both solid and liquid dimethyltin dichloride and the results are presented in Figure 1. The liquid sample heated to a temperature higher than its melting point showed a broad fluorescence background. Laser exposure of the solid sample at room temperature for a certain period of time prior to data acquisition eliminated the fluorescence interference but not the methyltin chloride. This process is called photobleaching.
Raman signal reveals that an impurity destructed as a result of prolonged laser exposure generated the fluorescence. The variation caused by this background noise was eliminated by subtracting and re-zeroing the baselines of the spectra of various samples. The resulting spectra were then compared.

Figure 1. Raman spectrum of dimethyltin dichloride with important bands labeled. The Raman bands are visible atop the fluorescence background. (Copyright © 2001 InfoScience Services.)
Experimental Results
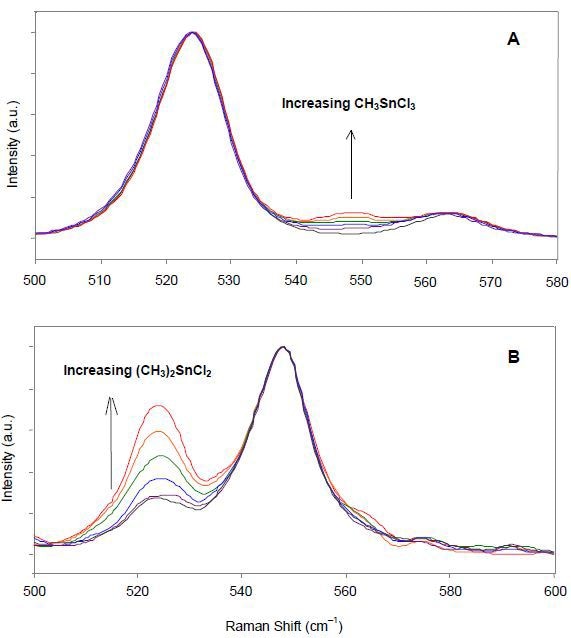
Dimethyltin dichloride and methyltin trichloride have characteristic Raman bands and therefore can be easily differentiated. The heights of characteristic Raman peaks of these species can be used to quantitatively determine their relative concentrations in a sample. Raman spectra of heated liquid samples in vials containing a large proportion of dimethyltin dichloride and varying concentrations of methyltin trichloride are shown in Figure 2A. Normalization of the spectral intensities to the intensity of the peak at 524 cm-1 was carried out, followed by correlation of the known fraction of methyltin trichloride to the normalized intensity of the 548-cm-1 peak.

Figure 2. Normalized Raman spectra of methyltin chloride mixtures of various compositions. (Copyright © 2001 InfoScience Services)
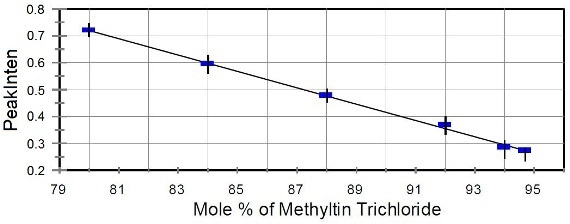
Raman spectra of heated liquid samples containing high methyltin trichloride content and varying compositions of dimethyltin dichloride were presented in Figure 2B. This next step was the normalization of these spectra to the intensity of the peak at 548-cm-1, followed by correlation of the known fraction of dimethyltin dichloride to the normalized intensity of the 524-cm-1 peak. Using these results, a calibration curve was constructed for methyltin chloride mixtures containing more than 80% methyltin trichloride (Figure 3).

Figure 3. Calibration curve for methyltin trichloride.
The calibration data was then used in the on-line Raman analysis of a process sample, providing results that were in good agreement with the at-line GC analysis data. The uncertainty in the composition of methyltin trichloride was roughly 1%.
Conclusion
The QA/QC process for production of methyltin chloride is greatly streamlined by in-line Raman spectroscopy. The requirement to extract grab samples from the process stream and off-line analysis make the GC analysis time intensive. Conversely, Raman spectroscopy performs in-line analysis in real time without compromising the data quality. With little or no sample preparation and the possibility of remote operation, the Raman analyzer provides a safer analysis, avoids product contamination, and allows for real-time process control.
About Kaiser Optical Systems
Kaiser Optical Systems, Inc. is a world leader in spectrographic instrumentation and applied holographic technology. Principal products include Raman sensors and instrumentation, advanced holographic components for spectroscopy, and astronomy and ultra-fast sciences. Principal offices and the manufacturing facility are located in Ann Arbor, Michigan.
Their products and services are deployed throughout the world in such diverse applications as pharmaceutical and chemical manufacturing, nanotechnology, telecommunications, education, forensic science, deep-sea exploration, and astronomy. From particles smaller than a human hair to objects as large as planets, their products are providing their customers unique insights into both today’s as well as “age-old” questions.
Kaiser was founded in 1979 to meet the need for diffractive or holographic optics for the avionics market. Kaiser entered the spectroscopy market in 1990 with the introduction of the holographic notch filter. In 1993 Kaiser released their first Raman analyzer, the HoloProbe. In 2013, the company became part of the Endress+Hauser Group.
To better serve the European community, Kaiser opened a new subsidiary in Europe in 1998. Kaiser Optical Systems SARL is located in Lyon, France. Kaiser SARL supervises their distributor network within Europe.

This information has been sourced, reviewed and adapted from materials provided by Kaiser Optical Systems.
For more information on this source, please visit Kaiser Optical Systems.