Magritek’s Spinsolve benchtop NMR spectrometer is a powerful analytical system designed for on-line NMR reaction monitoring in chemistry labs. The instrument can be directly installed in the fume hood of the lab to check the status of chemical reactions (Figure 1). With the help of a standard PTFE tubing, reactants can be easily pumped from the reactor to the magnet.
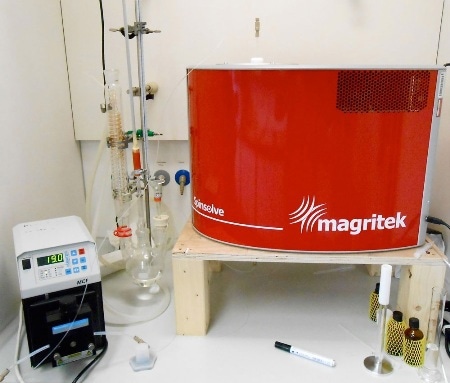
Figure 1. Spinsolve NMR spectrometer set up in a fume hood to monitor a batch reaction.
On-line NMR Reaction Monitoring
On-line NMR reaction monitoring offers the following benefits:
- Provides real time information
- Improves yields
- Identifies by-products and intermediates
- Determine reaction kinetics
- Determines reaction end points
- Terminates failing reactions early
- Eliminates sample preparation and isolation
- Saves time and cost
Spinsolve NMR
Spinsolve NMR spectrometer offers the following benefits:
- Provides structural data
- Eliminates the need for deuterated solvents
- Chemically specific
- Solvent-independent calibration
- Quantitative for all species
- Excellent time resolution
- High spectral resolution
- High stability with external lock
Specifications include:
- Resolution: 50% linewidth < 0.7Hz (16ppb)
- Frequency: 42.5MHz proton
- Lineshape: 0.55% linewidth < 20Hz
- Stray field: < 2 G all around system
- Magnet: Permanent and cryogen free
- Dimensions: 58 x 43 x 40cm
- Weight: 55kg
Acetalization of Acetaldehyde
Acetalization is defined as a standard reaction that yields an acetal from an alcohol and an aldehyde. It is catalyzed by acid and produces water as by-product. The following equation shows how acetaldehyde reacts with methanol to yield acetaldehyde dimethyl acetal.

The reaction is performed in dimethyl sulfoxide (DMSO) . First, 20mL of acetaldehyde is mixed in a 30mL of DMSO to prevent evaporation. Then, 35mL of methanol is introduced in drops to the reactor at a speed of approximately 1mL min-1. 0.5mL of hydrochloric acid was used a catalyst.
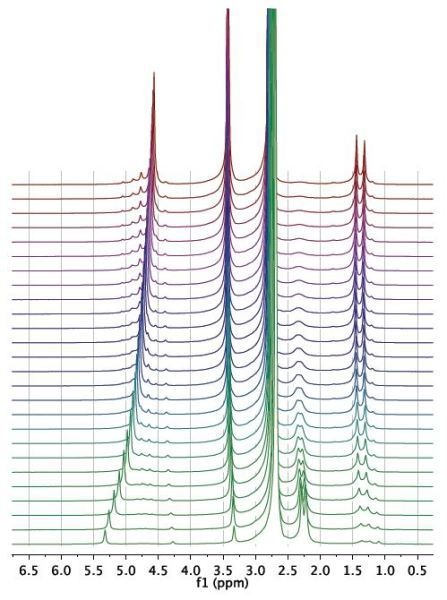
Figure 2. Waterfall plot showing NMR spectra acquired as a function of time during the reaction.
The reaction was then observed for a period of 1 hour and spectra were recorded for every 15 seconds, as illustrated in the waterfall plot (Figure 2). When the areas marked in purple and green are combined, it is possible to measure the total mass of acetaldehyde dimethyl acetal (purple) and acetaldehyde (green) in the reactor.
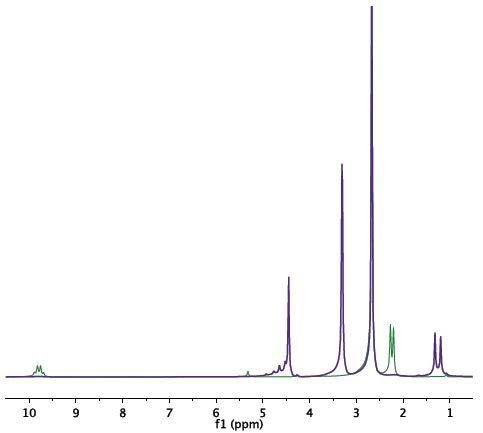
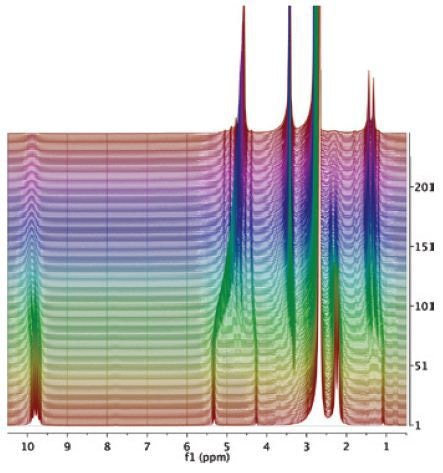
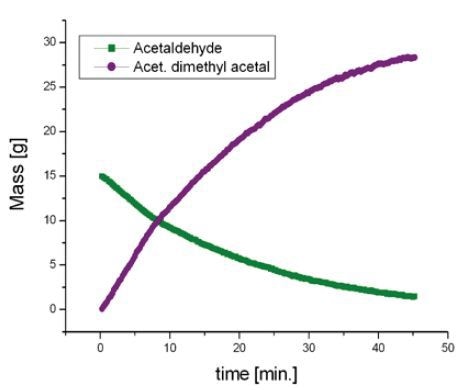
Figure 3-5. Spectrum of the initial mixture (green) shows the signal of acetaldehyde. At the end of the reaction (purple), signals of acetaldehyde dimethyl acetal and water at 4.7ppm can be observed.
The spectrum acquired for the original mixture (green) displays the acetaldehyde signal (methyl at 2.25ppm and carbonyl at 9.7ppm). Towards the end of the reaction (purple), the signals of acetaldehyde dimethyl acetal and water at 4.7ppm can be observed. A signal from DMSO at 2.7ppm does not impede with the signal of the products or reactants (Figure 3). Deuterated DMSO is not required for this reaction.
Conversion of Acetophenone to 1-Phenylethanol
In another example, the reduction of acetophenone (AP) to 1-phenylethanol (PE) was monitored by means of transfer hydrogenation with isopropanol. At the outset of experiments, the reactor included only isopropanol. After the pump was turned on, 2% of AP was introduced to the reactor followed by setting the NMR spectrometer to record NMR spectra at standard intervals of 10 seconds.
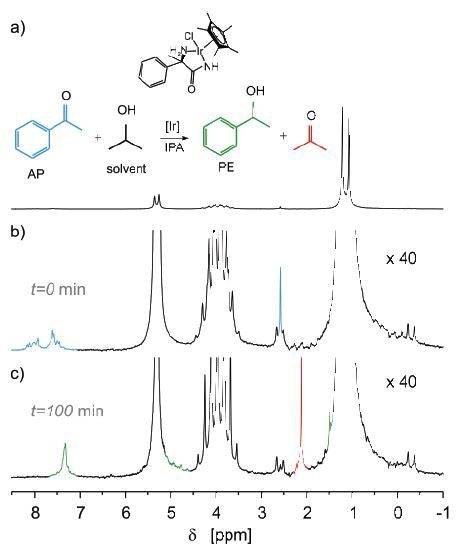
Figure 6. Reduction of acetophenone (AP) to 1-phenylethanol (PE).
The peaks in (a) match with three different isopropanol groups, while the AP signals (blue) are visible after the spectrum is zoomed by over an order of magnitude (b). Next, the solution was mixed with iridium catalyst and the reaction was observed for several hours. The end spectrum is illustrated in (c) (Figure 6). Thus, it can be concluded that the peaks of 1-phenylethanol (green) and acetone (red) have replaced the signals from AP.
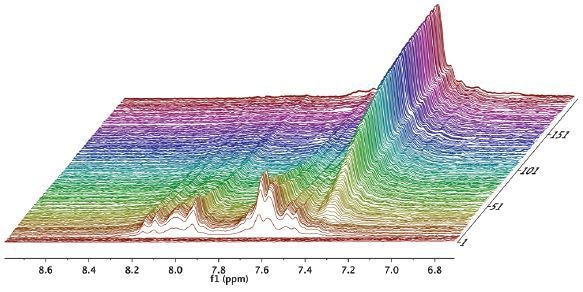
Figure 7. Zoom of the aromatic region of the spectrum.
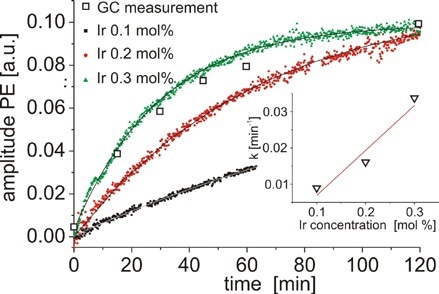
Figure 8. Concentration of PE as a function of time measured for three different concentrations of catalyst.
Additionally, the solvent peaks do not affect the aromatic region of the spectrum, and the signals can be combined to determine the concentration of PE (from 7.1 to 7.45ppm) and AP (from 7.85 to 8.3ppm) (Figure 7). Figure 8 shows the concentration of PE as a virtue of time quantified for different concentrations of catalyst. These results are evaluated with GC and indicate good agreement.
These results demonstrate that when reactants or products are diluted in protonated solvents, they can be accurately measured on-line using the Spinsolve spectrometer installed in the fume hood.
Flow Setup for On-line Monitoring
Figure 9 shows a typical setup for on-line monitoring. First, a dewar of 2.25mm i.d. and 5mm o.d. is placed in the bore of the spinsolve spectrometer which helps in reducing transfer of heat from the flowing sample to the magnet. By means of a 2mm o.d. PTFE tubing, the reaction mixture is pumped via the bore of the magnet.
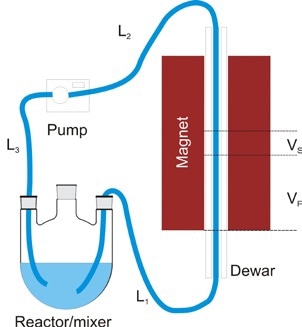
Figure 9. Typical flow setup
The pump is mounted after the magnet so as to reduce the tubing length L1 and can be set to operate in either stop-flow mode or continuous mode to attain points at approximately 15s. To ensure the stability of the spinsolve spectrometer, the temperature of the mixture inflowing the magnet should be maintained at 30 °C, but the reaction can be performed at roughly 100 °C temperature. As the reaction mixture passes along the L1 tubing length, the temperature of the reaction mixture cools down to 30°C or less.
Conclusion
Magritek’s Spinsolve Carbon benchtop NMR spectrometer is a compact and low-cost instrument that provides excellent sensitivity and unparalleled performance. The device also saves time, space, and cost and suitable for performing common 2D experiments.
About Magritek
Founded in 2004, Magritek is an advanced technology company exporting from Germany and New Zealand to customers all over the world. The initial technology and IP used in Magritek products was developed by research teams at RWTH Unviersity, Germany, and Massey University and Victoria University of Wellington in New Zealand.
Today, Magritek provides complete NMR and MRI system solutions for the oil and gas industry, as well as components and subsystems suitable for research laboratories and education.

This information has been sourced, reviewed and adapted from materials provided by Magritek.
For more information on this source, please visit Magritek.