Industries such as pharmaceuticals routinely perform particle size measurements as a critical-to-quality attribute for the product. Dispersion is crucial for any particle size measurement and wet and dry are the two major methods used in laser diffraction systems. A dry dispersion method is usually recommended for processing powder in a dry state to obtain a dry powder as the final product.
In the pharmaceutical industry, processing of active pharmaceutical ingredients (APIs) and excipients is generally carried out in the dry state, and a dry powder may be the end product, such as in dry powder inhalers. In the initial stages of product development, pharmaceutical Manufacturers may want to perform particle size measurements of a dry powder sample with a sample volume below 100 mg of material.
This article discusses measurements of aliquots down to 5 mg of fine grade, pharmaceutical lactose, and demonstrates that the repeatability of the measurements is within the guidelines on repeatability of the ISO laser diffraction standard. This fine grade of lactose was selected as a highly cohesive powder that poses difficulty in dispersion, as well as an established model material for APIs.
Measurement of a Fine Grade of Lactose
The experiment involved weighing out of aliquots of lactose with extreme care to prevent powder compaction or sticking to the weigh boat. An aliquot of 5 mg was selected to perform 20 measurements from the available sample volume of 100 mg. This provided adequate aliquots for reproducibility testing, as well as method development.
Dispersion Performance of the Aero S
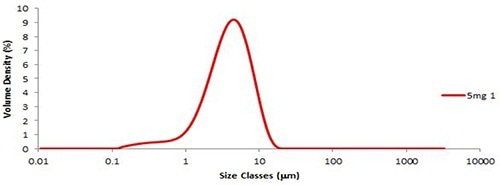
Preparation and dispersion of six aliquots of the fine grade lactose were then performed using the Aero S. Figure 1 presents a typical particle size distribution, showing reproducibility below 0.8% for Dv (50) (Table 1).

Figure 1. The particle size distribution of the first 5mg aliquot of the fine grade lactose.
This is well within the acceptable repeatability limits described by the ISO standard, which defines that the variability (RSD%) between the repeat measurements for Dv (50) must be less than 3%. Since fine lactose is a highly cohesive material, obtaining such low variability between measurements demonstrates the superior dispersion performance of the Aero S.
Table 1. Variation, as measured by RSD, in six 5mg aliquots of fine grade lactose.
| A |
DV (10)(µm) ISO 5% |
DV (50)(µm) ISO 3% |
DV (90)(µm) ISO 5% |
| 5mg 1 |
1.38 |
3.93 |
8.40 |
| 5mg 2 |
1.36 |
3.89 |
8.25 |
| 5mg 3 |
1.36 |
3.91 |
8.19 |
| 5mg 4 |
1.36 |
3.88 |
8.26 |
| 5mg 5 |
1.39 |
3.95 |
8.33 |
| 5mg 6 |
1.36 |
3.96 |
8.43 |
| 1RSD (%) |
0.949 |
0.795 |
1.11 |
Mass Titration
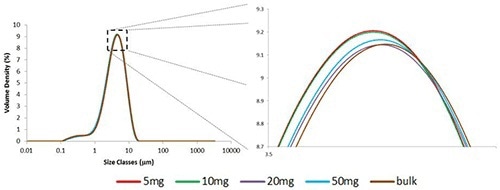
Performing a mass titration to relate the 5 mg aliquot to the bulk material corroborated that the 5 mg result is typical. A bulk measurement of roughly one teaspoon and measurements of three aliquots of 5 mg, 10 mg, 20 mg, 50 mg were performed. Figure 2 shows the comparison of the particle size distributions. The graph needs to be significantly expanded for separation of the measurements, revealing a very high level of consistency between the results.

Figure 2. Overlaid particle size distributions obtained from different masses of sample. The profiles of the distributions are so similar it is necessary to expand the graph significantly in order to separate them.
As shown in Table 2, the variability between the measurements of different volumes of aliquots, as quantified by the RSD, is below 1.5% for all three percentiles. This value is much less than the 3% variability described by the ISO standard for repeat measurements of the same sample, thus demonstrating the consistent performance of the Aero S in the dispersion of different volumes of the sample.
Table 2. Variation in the percentiles between aliquots of different masses.
| B |
DV (10) (µm) ISO 5% |
DV (50)(µm) ISO 3% |
DV (90) (µm) ISO 5% |
| 5 mg |
1.38 |
3.93 |
8.40 |
| 10 mg |
1.37 |
3.92 |
8.38 |
| 20 mg |
1.38 |
3.99 |
8.54 |
| 50 mg |
1.39 |
3.99 |
8.52 |
| Bulk |
1.41 |
4.06 |
8.61 |
| 1RSD (%) |
1.14 |
1.37 |
1.15 |
Significance of Sampling and the Effects of Particle Size
Besides good dispersion, the median size and span of the distribution also play a key role in achieving reproducible results. Tens of thousands of particles will be present, even in a 5mg sample, when the median particle size is small. The 5 mg sample can be taken as the representative of the entire population if the mixing of the sample is assumed to be homogenous.
The particle count in the sample decreases to the hundreds with increasing particle size. This makes the 5 mg sample less representative of the bulk. For instance, in the case of measuring coarse lactose with a Dv (50) of 100 µm in a 5 mg aliquot, variability in the percentiles would probably be higher, indicating the greater difficulty of sampling. Therefore, measuring a coarse material in a small aliquot may not be appropriate.
Were the span of the distribution large, it would indicate a polydisperse sample, meaning the mass of the aliquot would be restricted by the capability to sample from the large end of the distribution. Hence, it is necessary to perform a mass titration as described above to find the mass required to perform reproducible measurements. The minimum aliquot represents the smallest mass with RSDs within the limits of the ISO standard guidelines for repeat measurements of the same sample.
Conclusion
Measuring dry powders in trace amounts is essential in some industries, such as pharmaceuticals. This article presented the measurement of a model pharmaceutical material in 5 mg aliquots by means of the Aero S dry dispersion unit and the Mastersizer 3000. The results acquired with the 5 mg samples revealed a variation of below 1% RSD, demonstrating the superior performance of the Aero S to disperse fine powders. The results acquired with the 5 mg aliquot are in line with the results acquired from a bulk measurement.

This information has been sourced, reviewed and adapted from materials provided by Malvern Panalytical.
For more information on this source, please visit Malvern Panalytical.