Oil analysis can help to detect a number of factors, such as wear particles that represent defective components, impurities beyond the lubrication system, and any changes occurring in lubricant chemistry. Niels Maes, Asset Health Analyst at Allied Reliability Group, says that if such issues are identified early, preventive measures can be taken before any serious failure occurs. The Spectro 5200 Trivector Analyzer has been shown to detect water intrusion, unseen corrosion, improper lubrication, contaminants, and other similar causes of equipment failure. This article demonstrates several ways to improve throughput and cut down repair expenses through oil analysis.
Table 1. Oil Analysis shows water intrusion problems in can filling machines
| Sample Date |
Oil Ref |
|
7/7/ 2014 |
4/14/ 2014 |
1/7/ 2014 |
11/19/ 2013 |
10/15/ 2013 |
10/10/ 2013 |
10/4/ 2013 |
8/9/ 2013 |
7/10/ 2013 |
5/15/ 2013 |
3/1/ 2013 |
| Sample # |
(Click Here!) |
|
9450 |
9306 |
9024 |
8881 |
8842 |
8811 |
8773 |
8630 |
8610 |
8558 |
8441 |
| Lab # |
|
|
|
|
|
|
|
|
|
|
|
|
|
| Analyst |
|
|
Coservic |
Coservic |
Frederik |
Kenny |
Kenny |
Kenny |
Kenny |
|
Kenny |
Koen |
Koen |
| Unique ID |
|
|
9450 |
9306 |
9024 |
8881 |
8842 |
8811 |
8773 |
8630 |
8610 |
8558 |
8441 |
| Wear Status |
|
|
0 |
0 |
0 |
0 |
54 |
0 |
100 |
0 |
100 |
100 |
0 |
| Cont Status |
|
|
30 |
41 |
41 |
14 |
77 |
30 |
100 |
21 |
100 |
100 |
41 |
| Chem Status |
|
|
0 |
0 |
0 |
0 |
0 |
0 |
100 |
0 |
78 |
90 |
0 |
| Unit Usage |
|
|
|
|
|
|
|
|
|
|
|
|
|
| Oil Usage |
|
|
|
|
|
|
|
|
|
|
|
|
|
| Oil Added |
|
|
|
|
|
|
|
|
|
|
|
|
|
| NonFe Idx |
|
8 |
|
|
|
|
|
|
|
|
|
|
|
|
| PC Vol < 6u |
|
30 |
3.87 |
1.81 |
0.94 |
1.81 |
3.45 |
4.14 |
0 |
2.93 |
0 |
0 |
0.58 |
| PC Vol 6-14u |
|
31 |
4.95 |
6.81 |
8.07 |
1.42 |
7.16 |
4.04 |
0.75 |
2.42 |
1.01 |
0.75 |
18.27 |
| PC Vol >14u |
|
32 |
0.17 |
0.43 |
0.4 |
0.23 |
1.39 |
1.77 |
1,983.15 |
0.26 |
1,971.24 |
1,523.34 |
12.14 |
| PC Vol Total |
|
11 |
8.99 |
9.05 |
9.41 |
3.47 |
12 |
9.94 |
1,983.90 |
5.61 |
1,972.26 |
1,524.09 |
30.99 |
| System Debris |
|
33 |
0.22 |
0.23 |
0.24 |
0.09 |
0.3 |
0.25 |
49.6 |
0.14 |
49.31 |
38.1 |
0.77 |
| Vise 40C |
150 |
26 |
|
|
|
|
|
|
|
|
|
|
|
|
| Vise 100C |
18.8 |
27 |
|
|
|
|
|
|
|
|
|
|
|
|
| Vise Idx |
142 |
28 |
|
|
|
|
|
|
|
|
|
|
|
|
| Chemical Idx |
|
0 |
-6.3 |
-0.7 |
1.5 |
-1.9 |
|
-1.8 |
999 |
-0.3 |
76.5 |
165.5 |
0.1 |
| Contam Idx |
|
1 |
0 |
0 |
0 |
0 |
65.5 |
0 |
999 |
0 |
999 |
999 |
0 |
| Dielectric |
2.13 |
2 |
2.07 |
2.12 |
2.14 |
2.11 |
2.12 |
2.11 |
80 |
2.13 |
2.89 |
3.78 |
2.13 |
| Ferrous Idx |
|
3 |
0 |
0 |
0 |
0 |
65.7 |
0 |
999 |
0 |
999 |
999 |
1.4 |
| % Water |
|
4 |
0 |
0 |
0 |
0 |
0.066 |
0 |
999 |
0 |
999 |
999 |
0 |
| LCont Droplet |
|
5 |
0 |
0 |
0 |
0 |
4 |
0 |
2 |
0 |
2 |
4 |
0 |
| LCont Ferrous |
|
6 |
0 |
0 |
0 |
0 |
0 |
0 |
1 |
0 |
1 |
1 |
0 |
| LCont NonFe |
|
7 |
0 |
0 |
0 |
0 |
0 |
0 |
3 |
0 |
3 |
3 |
0 |
| DV Visc 40C |
150 |
9 |
149 |
148 |
140 |
143 |
147 |
146 |
|
148 |
178 |
159 |
157 |
| DV Visc % Chng |
|
10 |
0 |
0 |
-6 |
-4 |
-2 |
-2 |
|
0 |
19 |
6 |
4 |
| Cnts >4 |
|
12 |
88,925 |
60,712 |
46,338 |
37,307 |
86,615 |
87,874 |
31,089 |
61,368 |
30,468 |
24,217 |
54,928 |
| Cnts >6 |
|
13 |
25,269 |
32,266 |
31,782 |
6,349 |
30,748 |
18,249 |
31,567 |
11,794 |
30,820 |
24,556 |
46,192 |
| Cnts >10 |
|
14 |
558 |
1,185 |
2,857 |
346 |
2,021 |
1,025 |
31,320 |
369 |
30,320 |
24,232 |
18,181 |
| Cnts >14 |
|
15 |
60 |
105 |
156 |
69 |
373 |
318 |
30,567 |
58 |
29,359 |
23,502 |
4,310 |
| Cnts >18 |
|
16 |
14 |
32 |
23 |
23 |
105 |
155 |
29,751 |
21 |
28,236 |
22,715 |
884 |
| Cnts >22 |
|
17 |
5 |
13 |
6 |
9 |
42 |
88 |
28,957 |
10 |
27,145 |
21,969 |
275 |
| Cnts >26 |
|
18 |
2 |
7 |
3 |
3 |
21 |
48 |
27,497 |
5 |
25,140 |
20,650 |
109 |
| Cnts >32 |
|
19 |
0 |
3 |
1 |
1 |
8 |
20 |
25,582 |
2 |
22,585 |
18,940 |
30 |
| Cnts >38 |
|
20 |
0 |
1 |
0 |
0 |
3 |
5 |
22,690 |
1 |
18,741 |
16,482 |
6 |
| Cnts >70 |
|
21 |
0 |
0.1 |
0 |
0 |
0.2 |
0 |
13,997.30 |
0 |
8,491.10 |
9,617.80 |
0.2 |
| ISO >4 |
|
22 |
24 |
23 |
23 |
22 |
24 |
24 |
22 |
23 |
22 |
22 |
23 |
| ISO >6 |
|
23 |
22 |
22 |
22 |
20 |
22 |
21 |
22 |
21 |
22 |
22 |
23 |
| ISO >14 |
|
24 |
13 |
14 |
14 |
13 |
16 |
15 |
22 |
13 |
22 |
22 |
19 |
| NAS 1638 |
|
25 |
13 |
14 |
14 |
11 |
14 |
13 |
18 |
12 |
18 |
18 |
14 |
| pH |
|
29 |
|
|
|
|
|
|
|
|
|
|
|
|
Eliminating Water Intrusion in the Gearbox and Oil Tanks
Every hour, a line can fill and then seam up to 50,000 cans. An "Automated Clean in Place" program in the filling machines washes these cans with chemicals and water. Through oil analysis, ARG tracks the main oil reservoirs. In a span of just five months, recurring issues were encountered in the main drive with water entering the oil tanks and gearbox (Figure 1).
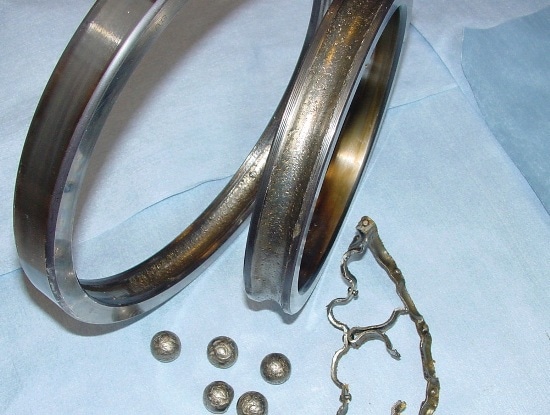
Figure 1. Oil Analysis shows water intrusion problems in can filling machines
Although the oil was often changed and seals were checked and replaced, the problem still persisted. Allied Reliability Group proposed that dry air could be supplied to the oil reservoirs. In order to prevent the seals from blowing out, the overpressure was restricted to a small level, which helped in preventing issues relating to water intrusion. In the same factory, a bottle washing machine is used to wash bottles prior to filling them.
The translation chain, driven by gearboxes, shifts the bottles through the machine. The ingoing shaft works at 55 rpm, while the outgoing shaft runs at just 1 rpm. For the ingoing shaft, vibration measurements have been effectively applied for condition monitoring, while the outgoing shaft is relatively slow to allow precise vibration measurements. As a result, for every three months, oil analysis is carried out on the shaft lubrication reservoir.
When the 5200 Minilab was used for such measurements, it showed that the number of wear particles in the oil increased. The initial step was to try changing the oil and redoing the oil analysis, but the amount of wear particles was quite high in this analysis too. The size and number of wear particles continued to increase, with particles that measured over 40 µm being revealed. At the first planned stop, the machine was shut down and checked. This analysis showed that the outgoing shaft had a severely damaged bearing. This issue was resolved by overhauling the reduction gearbox, but if this had persisted, the gearbox would have crashed and damaged other components as well. This, in turn, would have affected production, as the line could not run the rinsing machine until it was fixed.
In the same factory, a labeling machine can operate at 60,000 bottles per hour. Since this machine is characterized by structural limitations and high complexity, it means that only some components can be tracked by oil analysis. Oil analysis of the gearbox reservoir showed a water intrusion, an increased viscosity, and a considerable increase in the dielectric constant. Upon analysis, the gearbox revealed that glue had entered the oil reservoir as a result of seal failure (Figure 2).
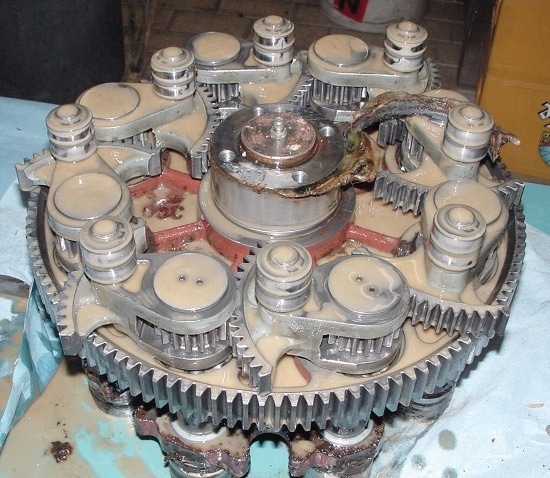
Figure 2. Oil analysis detects glue in the gearbox reservoir of a labeling machine
If this issue had gone undetected, the gearbox would have ultimately stopped, leading to high production losses and repair costs. Precise oil analysis allowed low-cost corrections, which helped in resolving the issue during the next planned production stop.
A cold rolling process is used by a steel mill, where metal stock travels through a single roll or more pairs of rolls to minimize both its thickness, and thickness fluctuation. The last cold rolling pass is the skin pass, involving the least amount of thickness reduction, usually 0.5 to 1%. This skin pass creates a smooth and homogeneous surface on the rolled steel plate, and the various reducers driving the skin pass are lubricated through a shared oil reservoir containing 6,000 L of Shell Omala 220 oil.
A new oil sample analysis demonstrated an increased number of particles, increased ferrous index, and reduced viscosity from 220 to 82 cSt. Allied Reliability Group proposed immediate inspection of the oil reservoir, which eventually revealed that a number of heating elements had failed, thereby increasing the ferrous index and particle count. The analysis also showed that the circulation pump had malfunctioned, causing the oil to overheat and reach extreme temperatures. Following this thorough inspection, the broken heating elements were replaced, the circulation pumps were repaired, and the oil during a formerly planned outage was also replaced. Analysis of oil sample collected from the same point showed that the issue was successfully resolved. If the steel mill had continued to use the machine with poor grade oil, the gearboxes would have been affected, leading to lost production and increased repair costs as a result of an unplanned outage.
Within the same steel plant, the vibrations of faster-moving shafts are tracked through vibration measurements (Figure 3). However, a shaft driving a gearbox at a speed of 9 rpm travels rather slow, thus rendering vibration measurement ineffective (Figure 3), so an oil sample is inspected every three months instead.
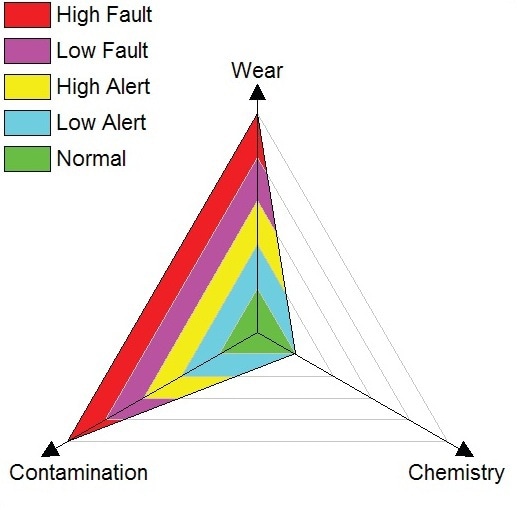
Figure 3. Oil analysis detects problems in slow moving shaft
Analysis of one oil sample revealed a sudden increase in ferrous particles and particle count, though no such anomalies were found in vibration analysis carried on other shafts driven by the same gearbox. At the next planned stop, the gearbox was opened up and checked. The bearing’s outer ring was black because of the heat produced by grinding. The bearing was replaced on time to prevent any further break down. Here, oil analysis helped in saving substantial amount in costs due to reduced repair expenses and prevented production outage.
In a steel producing plant, a 3 m diameter fan rotates at 1000 rpm to eliminate gases from steel converters. As the gases are very hot, it is important to cool the fan blades with water. However, this attracts steel dust to the fan blades, rendering them out of balance. To offset this issue, four oil chambers are built into the fan, and arranged at 90° from each other across the fan’s diameter. To balance the fan, oil is pumped between the chambers. Oil analysis is often carried out in this balancing system (Figure 4).
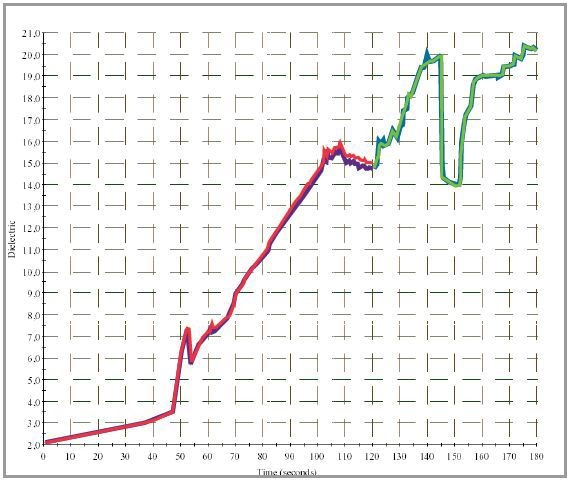
Figure 4. Oil analysis detects problem in fan balancing system
At some stage, it was observed that a large amount of water and contaminants were present in the oil. This issue warranted an inspection at the first scheduled stop. Soon after the analysis, the oil pump was damaged because of the increased water level. Upon inspection, it was found that one of the seals was damaged, leading to the entry of water into the balancing system from the fan blades.
An oil sample taken from a piston compressor revealed considerable amounts of water, and the presence of ferrous particles (Figure 5). The compressor was overhauled based on this outcome. At the time of inspection, the camshafts suggested extensive wear, which was possibly caused by reducing the oil’s lubricating properties, which, in turn, was induced by water intrusion. This intrusion was the result of a water separator failure. In this specific application, oil analysis not only prevented a production outage, but also reduced repair expenses.
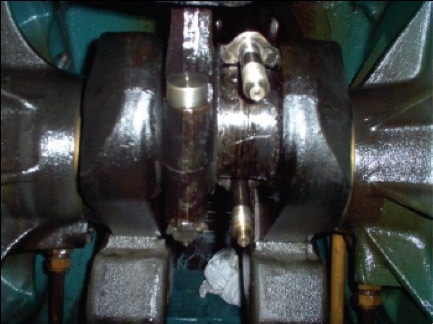
Figure 5. Oil analysis identified problem in piston compressor
Conclusion
Maes explained that these specific applications demonstrate how oil analysis provides considerable savings in terms of lost production and repair costs. Asset health monitoring allows early detection to prevent potential and unexpected failures, and help companies to plan and schedule maintenance.
The 5200 Minilab instrument clearly reveals lubricant chemistry, metal wear, and contamination levels. Lubricant condition monitoring not only saves oil, but also cuts down oil disposal expenses by driving maintenance on an on-demand basis. The 5200 Minilab even produces machinery health trend analysis, supporting data-driven predictive, as well as preventive, maintenance decisions.

This information has been sourced, reviewed and adapted from materials provided by AMETEK Spectro Scientific.
For more information on this source, please visit AMETEK Spectro Scientific.