Thermogravimetric analyzers (TGA) combined with mass spectrometers (MS) are widely used for studying gases that arise during a TGA analysis. During the analysis of complicated samples TG-MS can result in data that makes it almost impossible to distinguish between gases that evolve simultaneously.
The combination of gas chromatography mass spectrometry (GC/MS) and TGA not only helps in achieving a more detailed characterization of the material being tested, but also aids in the accurate determination of products from a TGA analysis. In this article the comparative benefits of the TG-MS and TG-GC/MS techniques are discussed in detail. Table 1 shows the strengths of TG-MS and TG-GC/MS techniques.
Table 1. Relative advantages of TG-MS and TG-GC/MS.
| TG-MS |
TG-GC/MS |
| Real-time analysis |
Sequential analysis |
| No resolution capabilities |
Resolves overlapping events |
| Limits to library effectiveness |
Resolution improves GC libraries effectiveness |
| Oxygen sensitive |
Oxygen sensitive |
| |
Can use alternate/multiple detectors |
| Simple |
More complicated |
Experimental Procedure
A PerkinElmer® Pyris™ 1 TGA using a standard furnace and alumina pans were used in this study. Iron and nickel were used to calibrate the instrument and the samples were allowed to run under the helium purge. Depending on the sample being analyzed, the rate of heating rates ranged from 5 to 40°C/min, and the furnace was allowed to burn off between runs in air. All the samples used in this experiment weighed roughly 10 to 15mg. The Pyris 9.0 software was used to perform data analysis.
The PerkinElmer Clarus® 680 C GC/MS was utilized during the TG-GC/MS analysis. In this TG-MS study, the MS was directly connected with a 0.1mm I.D. deactivated fused-silica transfer line which was heated to a temperature of 210°C. Similarly, in the TG-GC/MS analysis, the GC injector port was connected with a 0.32mm I.D. deactivated fused-silica transfer line joined to the Elite™-1ms capillary GC column. The TurboMass™ GC/MS software was used to conduct data analysis in both cases.
Results and Discussion
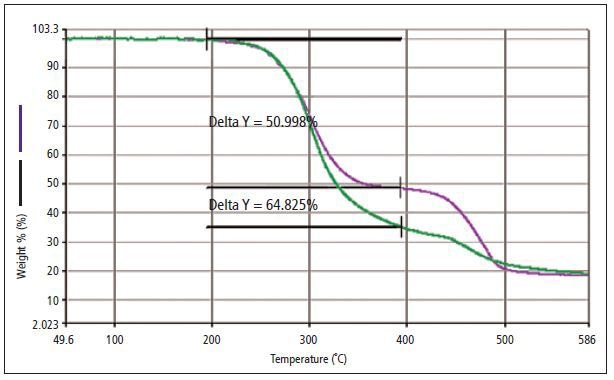
Polyvinylchloride (PVC) was prepared with two different forms of phthalates; a regulated disiononyl phthalate (DINP) and a non-regulated phthalate formulation were examined to determine whether a difference can be observed and correlated to the phthalate type. Figure 1 shows the thermogram acquired from the analysis of two different samples of PVC. The green line in the thermogram with 64.82% weight loss corresponds to PVC with the non-regulated mixture of phthalates and the purple line with 50.99% weight loss corresponds to PVC with DINP.

Figure 1. TGA percent-weight-loss curve generated from the analysis of two PVC samples: one with DINP (purple), a regulated phthalate, and a weight loss (delta y) of 50.998%; and a second with a mixture of non-regulated phthalates (green) and a weight loss (delta y) of 64.825%.
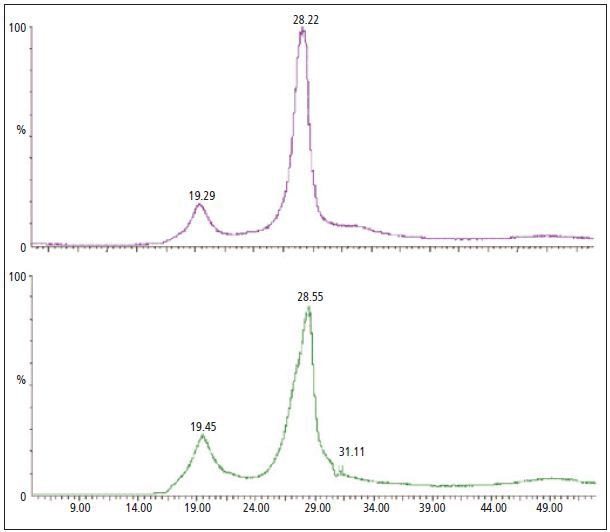
The weight-loss curve from the TGA analysis reveals a distinct variation between both materials. This could be due to the different types of additive or the quantity required to attain required physical properties in the PVC sheeting. Both GC/MS and MS methods were applied to examine the gas that evolved from each individual sample. This was done to establish whether either of the techniques is capable of identifying the absence or presence of regulated phthalates vs. non-regulated phthalates. The MS data acquired from each sample analysis is shown in Figure 2.

Figure 2. The MS analysis of the evolved gas generated during the TGA analysis of PVC materials with DINP (purple - top) and a mixture of non-regulated phthalates (green - bottom).
However, in Figure 2 it is difficult to detect differences between individual materials. The gas that evolves during the TGA analysis revealed only a slight variation in the MS. Both significant weight-loss events produced a gas mixture producing many ion fragments. TG-MS is a valuable tool when the gases that evolve during TGA analysis are relatively simple. In order to identify individual components resolution of the evolved gas is required.
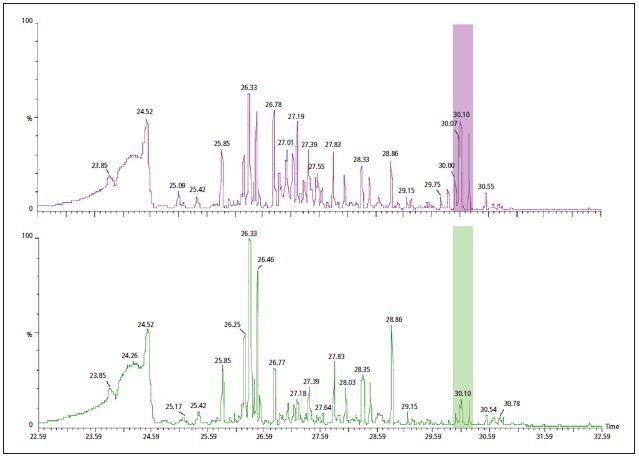
Once again, the TGA analysis was carried out with the first weight loss sample taken and introduced within a GC column. This process aids in the better identification of specific components and increases the resolution of evolved gases. Figure 3 shows the chromatogram acquired from the analysis of gas evolved during the TGA’s initial weight loss. Here it can be observed that the evolved gas is complex and has a chromatogram containing many unresolved different components.

Figure 3. The GC/MS data collected during the TGA analysis of PVC with DINP (purple - top) and with a mixture of non-regulated phthalates (green - bottom). Differences are noted in peaks with tentative identification as phthalates around 30 minutes.
In this example it was easy to observe the differences in the evolved gas of individual TGA, but major differences were mostly seen in the peaks after approximately 30 minutes. These peaks had a powerful response at m/z 149 - an ion related to many number of phthalates. However, more research is required to establish whether the analytical approach used in this study offers quantitative and/or qualitative data. Nevertheless, when the TG-GC/MS technique is used instead of the TG-MS approach the differences are more prominent.
Conclusion
This article has shown how TGA analysis can be effectively used for measuring a material’s weight loss at particular temperatures. MS is capable of detecting the species that evolve during thermal analysis and improves the technique’s power. However, when a complex gas evolves during an event MS data interpretation can become difficult. In contrast, co-evolved gases can be chromatographically separated using the TG-GC/MS. As a result individual components can be easily identified and the data interpreted in comparison to TG-MS alone.

This information has been sourced, reviewed and adapted from materials provided by PerkinElmer.
For more information on this source, please visit PerkinElmer.