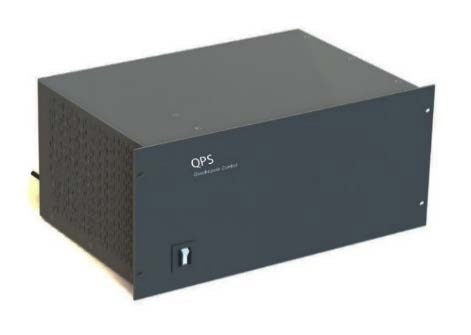
Process Insights’ newest Quadrupole Power Supplies (QPS) provide unmatched long-term stability. This article outlines two of the most critical performance factors for QPS:
- Mass stability
- Resolution stability

Mass Stability
Potentially the most noted performance factor for QPS is the mass stability. Typical specifications for mass drift are 0.1 Da over 48 hours. To demonstrate the outstanding mass stability performance, a QPS was operated at 2.9 MHz to drive a 19 mm Tri-filter QMF configured as part of a MAX instrument with a mass range of 1 to 50 Daltons.
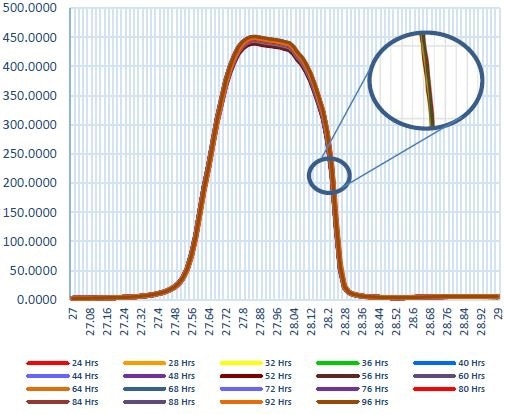
Data was collected continuously for 76 hours. An overlay of 19 scans from the data set taken at an interval of four hours is shown in Figure 1. The peak position movement is measured to be just 0.0008 Daltons, meaning there was essentially no movement over the 76-hour operating period.

Figure 1. 76-Hour Mass Stability, Spectra Extracted Every 4 hours Overall STD 0.0008 Da
Peak Position Does Not Change Over 76 Hours
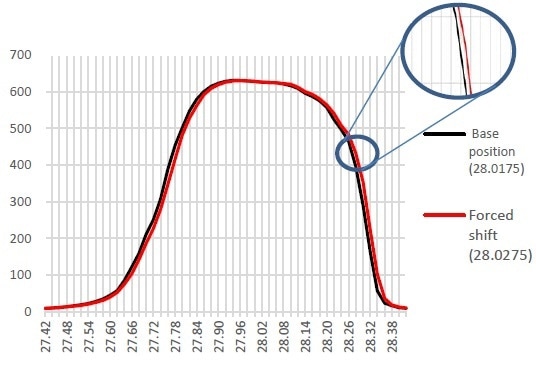
The programmable mass position command in Process Insights’ “Merlin” software application was used to shift the peak position until the change was identifiable, so that the limits to which mass drift can be detected visually can be determined. A peak that was moved by just 0.01 Da employing the Merlin Automation Data System is shown in Figure 2.
The mass drift is barely visually perceptible, and is a factor of x10, which is better than most commercial specifications. Looking more closely at the exploded portions of the plot, which show the peak edge at approximately half the maximum height, it can be seen that the earlier data obtained from the 76 hours of continuous scanning fits well within the forced shift. The mass drift of the QPS is visually undetectable.

Figure 2. Mass 0.01 Da Mass Shift
Warm-up
The time taken by a QPS to stabilize is often called a “warm-up.” One good performance indicator is the time taken to warm up from a cold start, and the time also provides an indication of quality QPS design.
In order to test the start-up mass drift, the mass position at the end of a 4-day experiment was compared with the mass position from a cold start, and for various times in between (Table 1). Exceptional mass stability was, once again, demonstrated as the initial start-up mass position was less than 0.06 Da from the mass position four days later.
Table 1.
| Elapsed Time from Cold Start (hours) |
Normalized Mass (Da) |
Difference from Final Mass Position (Da) |
| 0 |
28.0536 |
0.0536 |
| 1 |
28.0421 |
0.0421 |
| 2 |
28.0386 |
0.0386 |
| 4 |
28.0286 |
0.0286 |
| 8 |
28.0185 |
0.0185 |
| 12 |
28.011 |
0.011 |
| 16 |
28.0035 |
0.0035 |
| 96 |
28 |
0 |
Resolution Stability Yields Excellent Repeatability
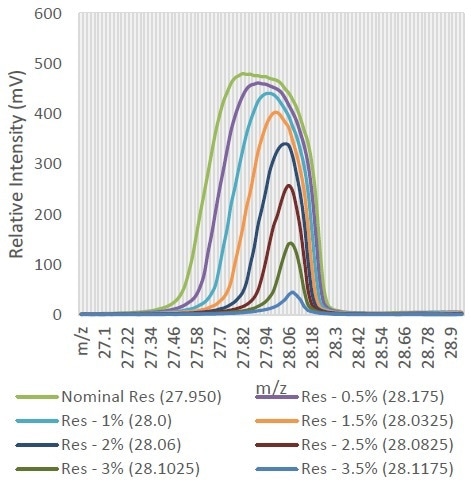
The other key performance factor is the resolution stability as it influences the repeatability of the ion intensity measurement. In order to demonstrate the impact of resolution stability, Figure 3 shows a series of peaks where the programmable resolution command in Merlin was used to transition a peak from low resolution to high resolution.
The peak height depends more and more on the resolution as it is increased. The resolution change observed between the peaks is 0.5%, and for the first 0.5% resolution change, the maximum intensity for the peak changes by more than 4%. It is clear that extremely high resolution stability results from a repeatable peak height.

Figure 3. Resolution Impact on Intensity
Figure 1 also shows that the width of the peak - the resolution - is also incredibly stable over the full 76-hour measurement period. The peak width (ΔM), defined as the Full Width at Half Maximum (FWHM), is considered in order to evaluate the resolution stability of the Process Insights QPS, and the peak width over the period of the test is collected using Process Insights’ Merlin software.
While the average width at half the maximum height was 0.05829 Da, the Standard Deviation was just 0.0004 Da. Any resolution drift is not identifiable, as was in the case of the mass stability.
Process Insights QPS products perform well, as they are flexible enough to drive Process Insights’ “MAX” range of application-specific Quadrupole Mass Spectrometers and also any of Process Insights’ stand-alone quadrupole mass filters (QMFs).

This information has been sourced, reviewed and adapted from materials provided by Process Insights - Mass Spectrometry.
For more information on this source, please visit Process Insights – Mass Spectrometers.