This analysis focuses on identifying the chemical composition of extractables and leachables from three medical grade polymer films: a Thermoplastic polyurethane (TPU), a silicone based, room temperature cured, biomedical grade elastomer (Silicone) and polycarbonate (PC).
Summary of Results
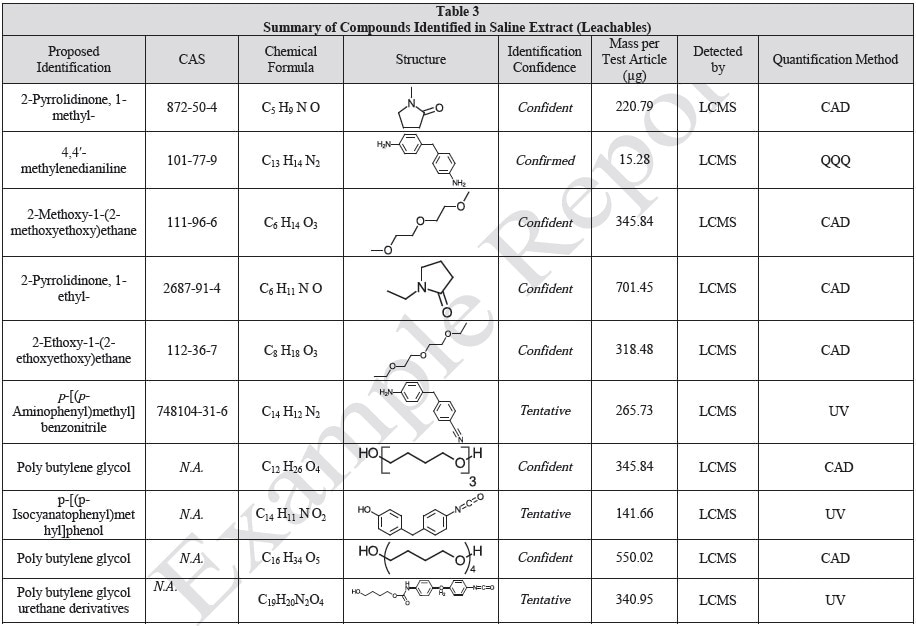
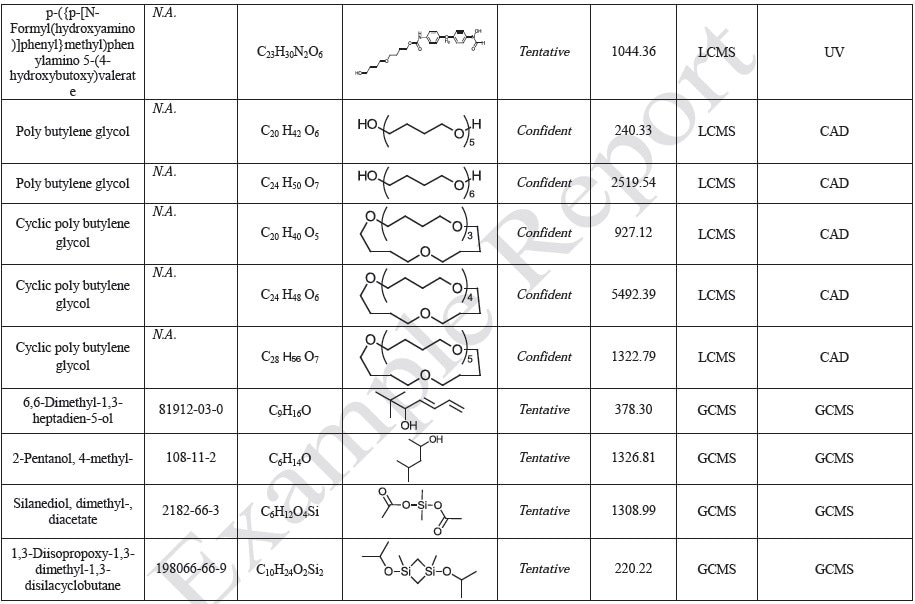
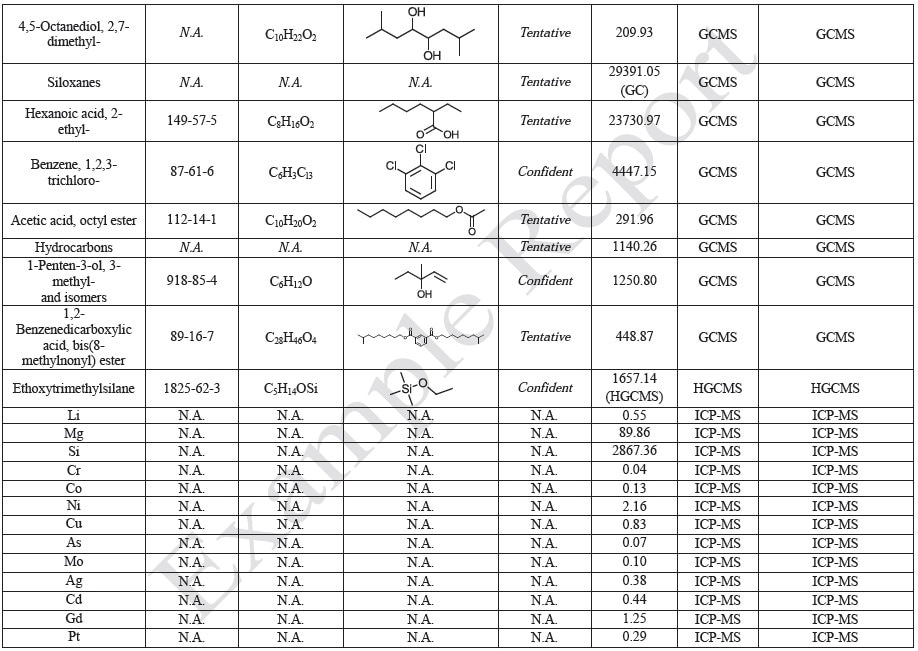
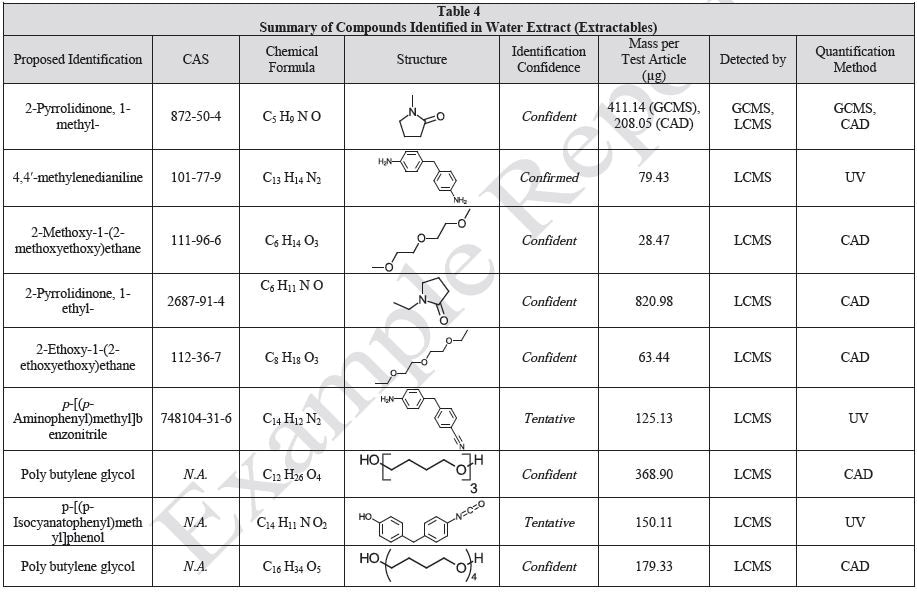
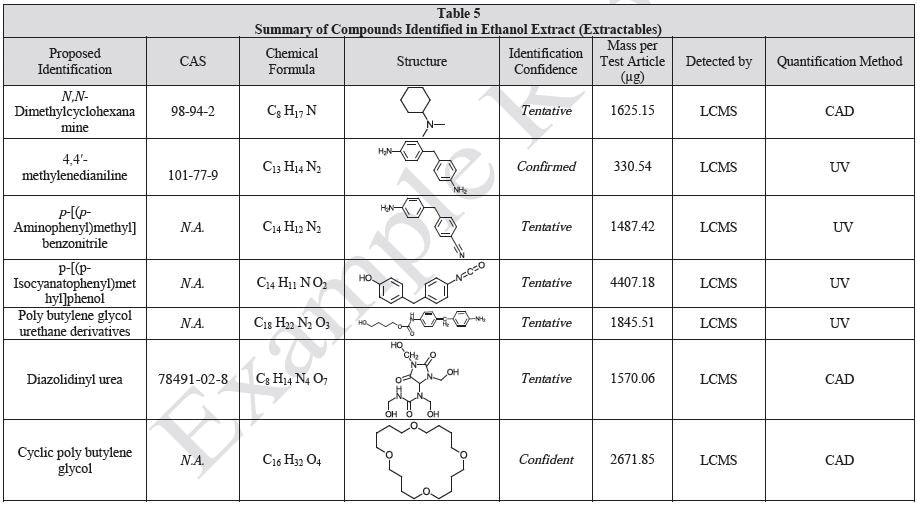
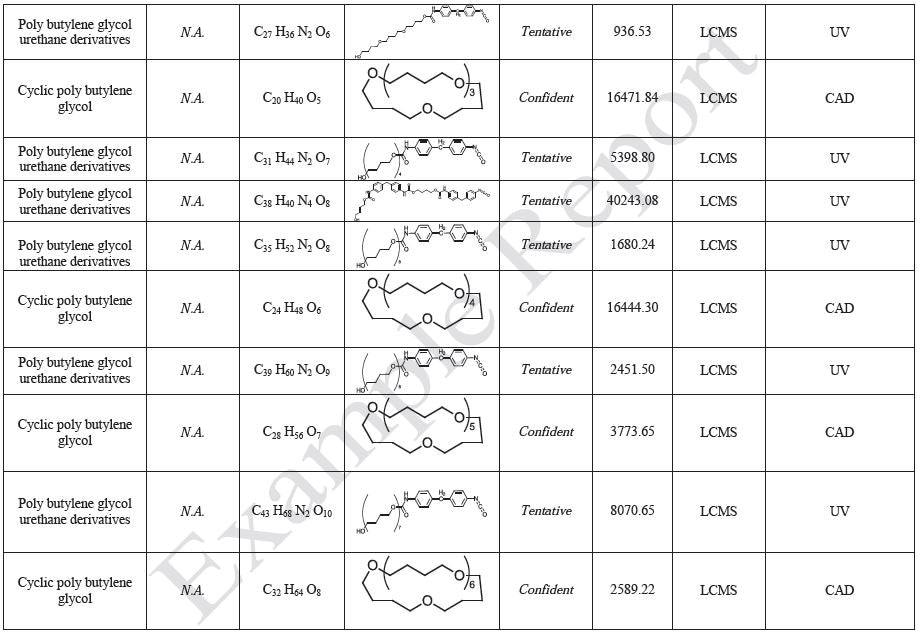
The polymer films were subjected to extractions with ethanol, water and hexane (extractables) and saline solutions (leachables). The resulting extracts were analyzed by QTOF-LCMS, HGCMS, QTOF-GCMS, and ICP-MS. Tables 3 to 6 presents a summary of the extractables and leachables detected in the extracts.
Table 1. Alphabetical List of Acronyms
| . |
. |
| CAD |
Charged Aerosol Detection |
| CAS |
Chemical Abstracts Service Registry Number |
| HGCMS |
Headspace Gas Chromatography Mass Spectroscopy |
| ICP-MS |
Inductively Coupled Plasma Mass Spectroscopy |
| N.A |
Not Applicable |
| N.D. |
Not Detected |
| N.D.L. |
Not Detected by LCMS |
| N.D.H. |
Not Detected by HPLC |
| N.F. |
Not Found |
| QQQ |
Triple Quadrupole Mass Spectrometer |
| QTOF-GCMS |
Quadrupole Time of Flight Gas Chromatography Mass Spectroscopy |
| QTOF-LCMS |
Quadrupole Time of Flight Liquid Chromatography Mass Spectroscopy |
| UHPLC |
Ultrahigh Performance Liquid Chromatography |
| UV |
Ultraviolet |
| FTIR |
Fourier Transform Infrared Spectroscopy |
| Semi-Quant |
Semi-Quantitative Analysis |
Table 2. Analysis Methods
| Extract |
Saline |
Water |
Ethanol |
Ethanol Precipitate |
Hexane |
Purpose |
| Non-volatile Residue |
X |
X |
X |
|
X |
Screen for Non-volatile Extractables |
| QTOF-GCMS |
X |
X |
X |
|
X |
Volatile, Semi-volatiles Compound Identification |
| QTOF-LCMS |
X |
X |
X |
|
X |
Non-volatile, Ionizable Compound Identification |
| QQQ |
X |
|
|
|
|
Quantitation of 4,4-methylenedianiline |
| HGCMS |
X |
X |
|
|
|
Volatile Compound Identification |
| ICP-MS |
X |
X |
|
|
|
Metals analysis |
| GCMS-Semi-Quant |
X |
X |
X |
|
X |
Semi-quant of Volatile, Semi-volatile Compounds |
| UHPLC-CAD-UV |
X |
X |
X |
|
X |
Semi-quant of Non-volatile, Ionizable Compounds |
| FTIR |
|
|
|
X |
|
Precipitate Identification |


Sample Preparation and Gravimetric Analysis
| Materials |
CAS |
Manufacturer |
Lot (Expiration) |
| Ethanol (EtOH) |
64-17-5 |
Pharmco |
Lot C15F09002-00RE200-FB; Batch WO103588 |
| Water (H2O) |
7732-18-5 |
Jordi Labs (ID 917) |
|
| Hexane |
110-54-3 |
Pharmco |
C15A22DRM-000HX95 |
| Sodium Chloride (NaCl) |
7647-14-5 |
Sigma |
Lot MKBF1522V |
Polymer sheets of PDMS, PC, and TPU were prepared for each polymer with a thickness of no less than 0.5 mm, and these sheets were then cut into approximately 8 cm × 8 cm pieces. Several pieces of each polymer sheet was used to obtain a total surface area of approximately 500 cm2 for each polymer, and approximately 500 mL of extraction solvent was added to the mixture of three polymers in order to attain an extraction ratio of 3 cm2/mL:

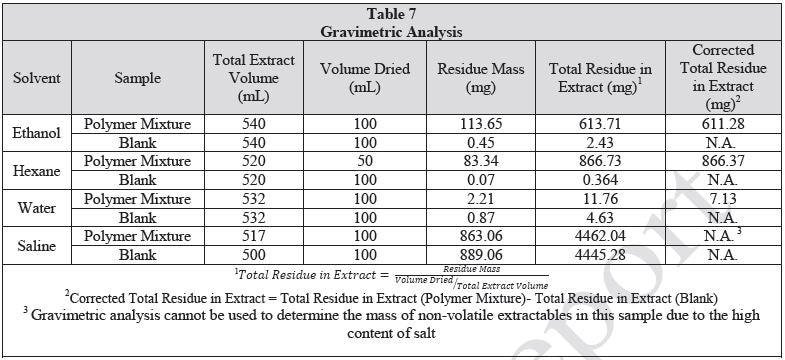
The extraction vessels were closed and then placed in ovens. The same lot was used to prepare control extracts and approximate volume of solvent used for the respective extractions. The water and saline extractions were carried out at 70 °C. The ethanol and hexane extractions were carried out at 50 °C. All extractions were permitted to continue for 72±2 hours with shaking at 50 rpm. Following cooling of the extractions, an aliquot (50 mL for hexane extract, 100 mL for ethanol, water and saline extracts) from each extract was removed. Precipitation was observed in the ethanol extract upon cooling. Before the ethanol extract was concentrated by rotary evaporation, the particulates were filtered out of the solution. No particulates were observed in the remaining extracts. The concentrated samples were quantitatively transferred to a pre-massed scintillation vial and then dried to a constant mass under a mild stream of nitrogen with heating at approximately 70 ºC. After achieving constant mass, samples were subjected to gravimetric analysis. Table 7 summarizes the gravimetric results. The remainder of the extract was retained for LCMS, HGCMS and GCMS analysis.
Particulate Identification
Particulates were noted in the ethanol extracts. The particulates were recovered by filtration and dried under vacuum for a period of 48 hours. Insoluble particulate material amounting to 19.16 mg was obtained from filtering the ethanol extraction solution of the polymer mixtures, and was then analyzed by FTIR.
Results
Figure 1 shows an FTIR micrograph of the insoluble particulates from the ethanol extract. It was discovered that the particulates were consistent with a mixture of polyamide and polyurethane. It was noted that two C=O stretches were consistent with polyurethane, while one C=O stretch consistent with polyamide was noted. In the region between 1570 to1500 cm-1, three overlapping absorbances are also observed. This highlights that the particulates are made up of two types of urethane and one type of polyamide. Table 8 provides particular absorbance assignments for the particulates. Additional identification of the particulates including monomer type could be provided with pyrolysis mass spectroscopy (PYMS). Figure 2 shows the FTIR spectrum of the particulates.
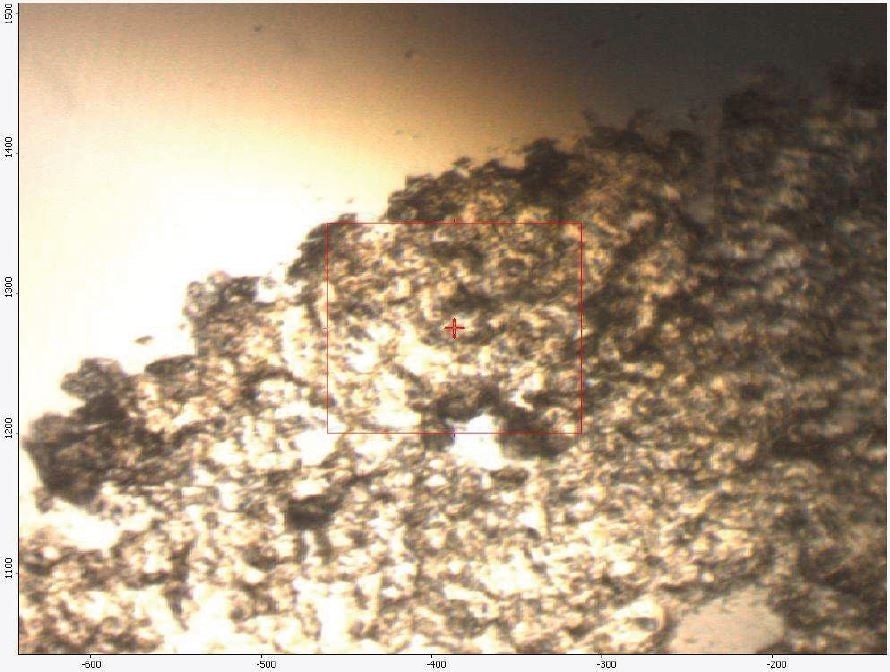
Figure 1. FTIR Micrograph of the insolubles
Table 8. FTIR Results
| IR Frequency (cm-1) |
Functional Group |
Possible source |
| 3302, 3084 |
NH stretch |
Polyurethane, polyamide |
| 2955, 2918, 2850 |
CH stretch |
Polyurethane, polyamide |
| 1731, 1702 |
C=O stretch |
Polyurethane |
| 1636 |
C=O stretch (Amide I) |
Polyamide |
| 1564, 1549, 1536 |
N-H bend , N-C-O stretch (Amide II) |
Polyurethane, polyamide |
| 1471, 1463, 1448, 1414 |
CH2 bend |
Polyurethane |
| 1377 |
CH3 bend |
Polyurethane |
| 1311 |
C-O stretch |
Polyurethane, polyamide |
| 1249 |
C-N stretch |
Polyamide |
| 1224 |
N-(C=O)-O stretch, asymmetric |
Polyurethane |
| 1110 |
C-O-C stretch |
Polyurethane |
| 1019, 944 |
N-(C=O)-O stretch, symmetric |
Polyurethane |
| 817 |
NH rock |
Polyurethane, polyamide |
| 742, 728, 720 |
CH2 rock |
Polyurethane |
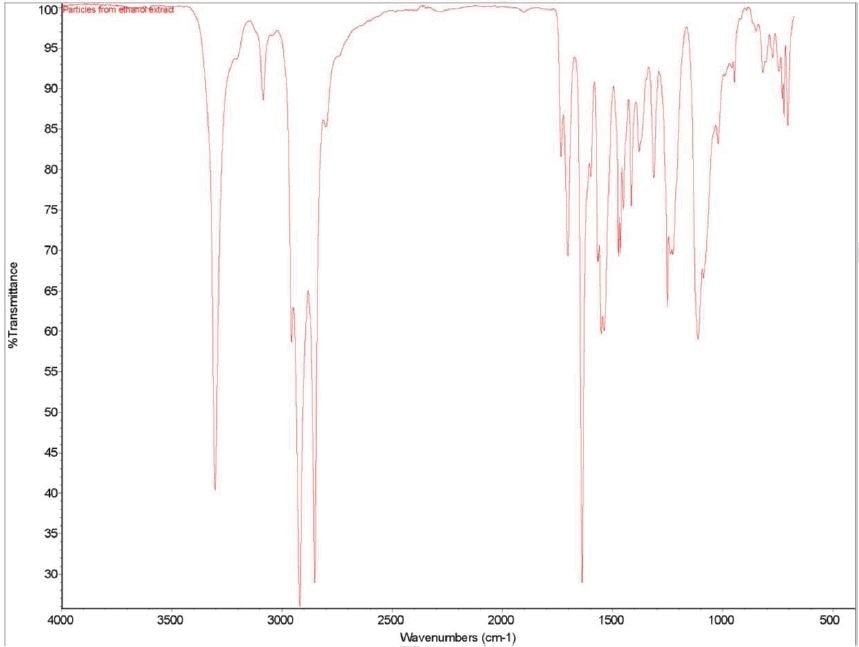
Figure 2. FTIR spectrum of the particulates from ethanol extract.
MS Data Interpretation
Mass spectral identifications are based on comparison with the NIST spectral library of more than 796,613 compounds as well as Jordi proprietary databases. Manual data review has also been performed to confirm the database identifications. This includes a review of the predominate ions in the mass spectrum of each unknown followed by confirmation that these ions are also observed in the database spectra. When evaluating the match quality as appropriate, ion intensity ratios are also taken into account. If high mass accuracy data is available (QTOF-LCMS or QTOF-GCMS), molecular formula generation (MFG) can be performed to establish the best matching elemental composition for the individual ions. MSMS spectra are also examined to help in identification.
A rating of confirmed, tentative, confident or unknown has been assigned (based on guidance provided by USP 1663) to each identification in order to provide an indication of the confidence level linked with a given identification. As stated in USP 1663, “Given the number and chemical diversity of organic extractables, it is unreasonable to expect that authentic reference compounds will be available (or can be made available) to confirm every identification. It is therefore necessary that levels of identification confidence be established and appropriately utilized. Data typically available from GC/MS and LC/MS analyses (see A through E below) are used to designate individual extractables identifications in the categories of Confirmed, Confident, or Tentative:”
a) Mass spectrometric fragmentation behavior (MSMS)
b) Confirmation of molecular weight
c) Confirmation of elemental composition
d) Mass spectrum matches automated library or literature spectrum
e) Mass spectrum and chromatographic retention index match authentic reference compound
A Confirmed identification means that A, B (or C), and D (or E) have been fulfilled. A confident identification highlights the possibility of using a combination of D with any of A, B or C. A Tentative identification means that data has been obtained that is consistent with a class of molecule only. An Unknown identification explains that the class of molecule cannot be identified based on the obtained data.
QTOF LCMS
Background: In order to provide thorough information about the elemental composition of unknowns, QTOF-LCMS incorporates high mass accuracy time of flight mass spectroscopy with the power of a liquid chromatography separation.
The presence of an additional quadrupole mass spectrometer (Q) provides the added capability to carry out fragmentation experiments. This indeed increases the confidence of unknown identification. It is recommended that a standard of the suspected unknown be analyzed under identical conditions as the sample. If the fragmentation patterns, isotope patterns, high accuracy mass data and LC retention times match for the unknown and standard then there is an extremely high probability that the identification is correct. Considerable information about the structure of an unknown can be gained, even in situations in which standards are not available by using the molecular formula generation (MFG) algorithms contained in the Mass Hunter qualitative software.
The molecule of interest must be ionized for LCMS. Thus, data is usually plotted in positive and negative modes indicating the charge on the ions. Ion formation is achieved through the formation of a molecular adduct by using a charge carrying species. Typical charge carriers in positive ion mode comprise of H+, Na+, K+, NH4+ etc. Thus, the observed mass is normally the mass of the compound plus the mass of the charge carrier.
The ions formed are determined by the nature of the mobile phase and the ionization conditions. In negative ion, the loss of hydrogen is usually observed and this leads to the loss of one mass unit (1.0078 amu). Other transformations are also possible including dimer formation, dehydration, etc.
A number of plots are used to help in interpreting QTOF-LCMS data. This includes Base Peak
Chromatograms (BPC), Extracted Compound Chromatogram (ECC), Extracted Ion Chromatograms (EIC), Product Ion Spectra (MSMS) and Mass spectra (MS). A BPC is formed by plotting the extremely intense ion at a given retention time. This spectrum is chiefly useful for identifying the retention time of unknowns. EICs are formed by plotting a single mass at all retention times. This could be considered as a plot of peak intensity (~compound concentration) for a single compound (and its isomers) versus retention time. ECC’s are the sum of all the ions determined to be related to a single compound.
MS spectra plot the observed masses and their intensities at a single retention time. The fragmentation pattern for a single compound is shown by MS/MS spectra. Mass Spectra plot the mass to charge ratio (m/z) and not the mass of the compound.
The best estimates were indicated by all structures based on the data observed. In most cases, the MS/MS fragmentation spectra have been briefly consulted to aid in identification of possible structures.
Sample Preparation
Before being analyzed by QTOF-LCMS, the water and saline extracts and blanks were concentrated 10 times. The ethanol extract was analyzed as prepared and was filtered before being analyzed. The hexane extract was dried and reconstituted in an equal volume of 80/20 methanol/isopropanol (v/v) solvent before the analysis. Hexane and ethanol extracts were not concentrated because of the mass of extractables observed in gravimetric analysis.
Results
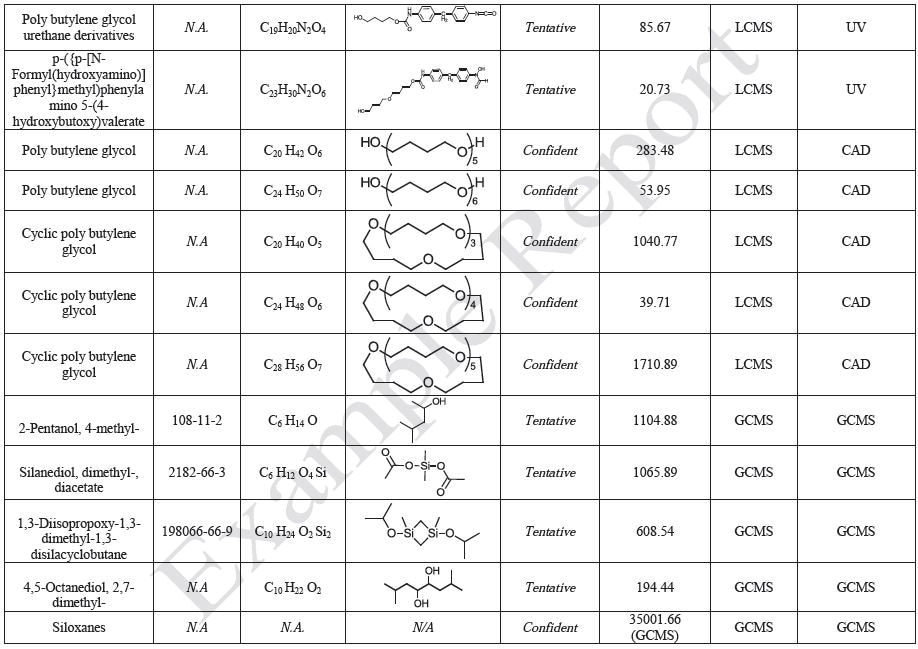
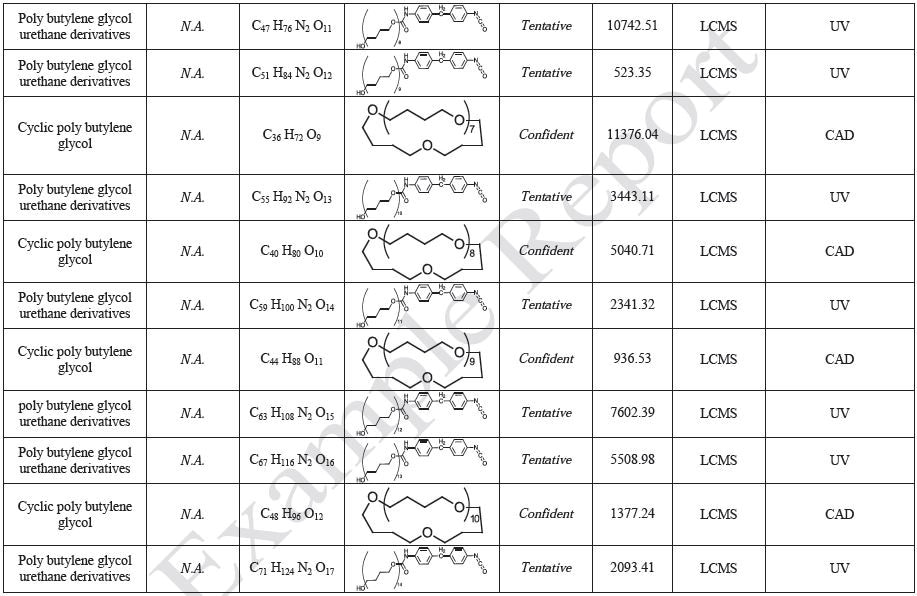
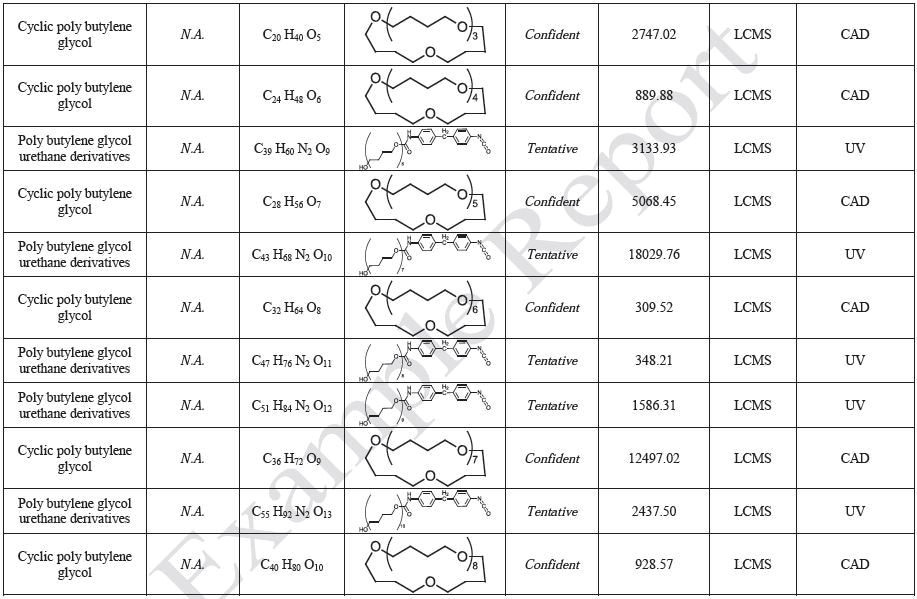
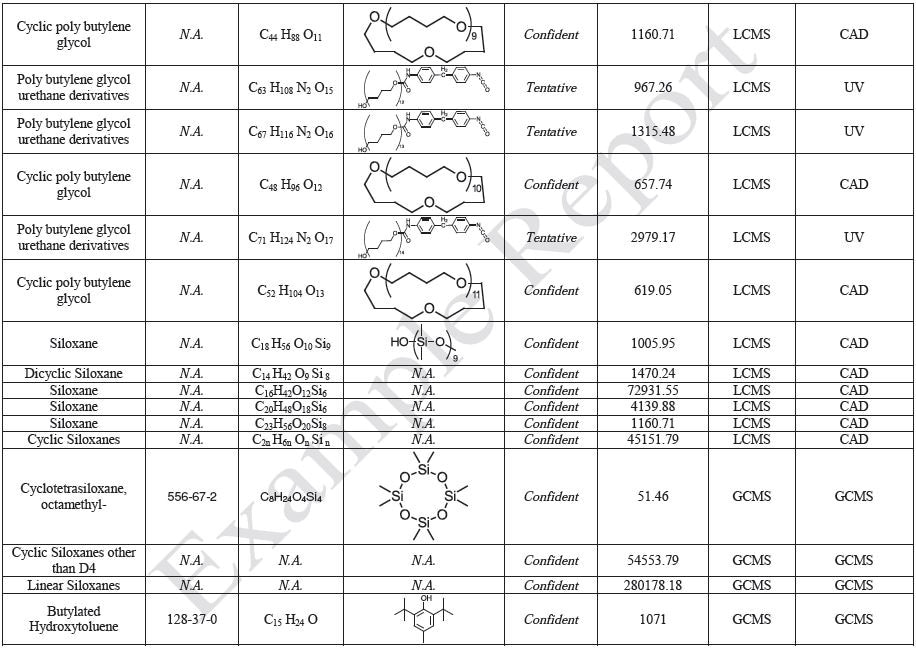
Tables 9-12 presents a summary of the LCMS results for the sample extracts in ethanol, hexane, water, and saline, respectively. Figure 3-10 presents overlays of the base peak chromatograms (BPCs) obtained in positive and negative ionization modes, respectively.
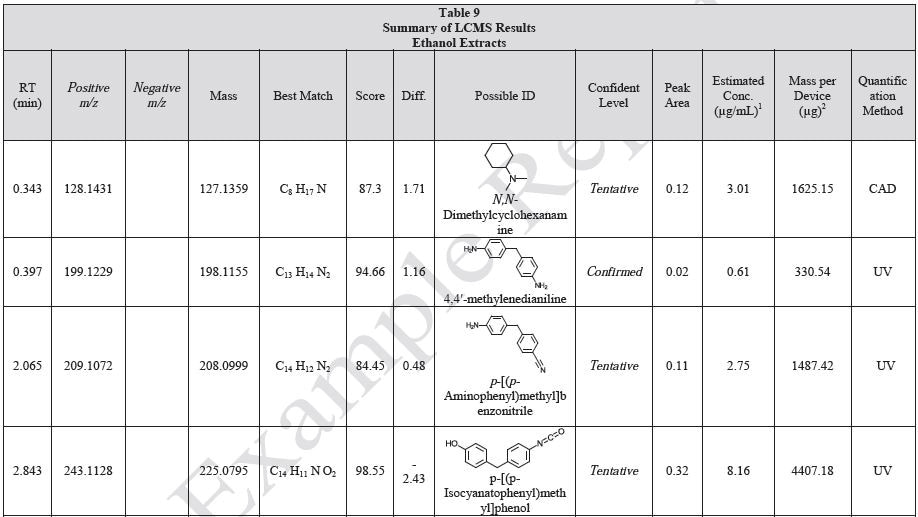
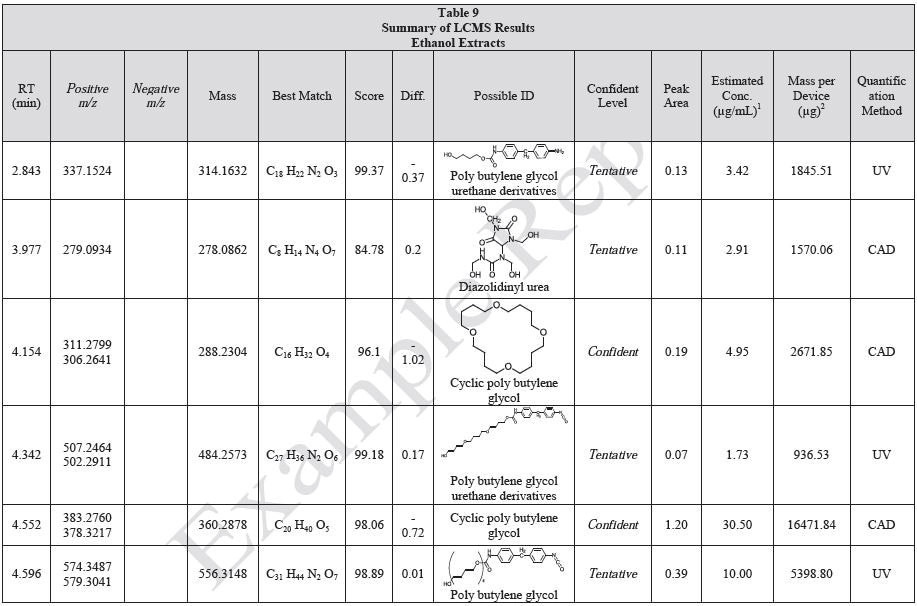
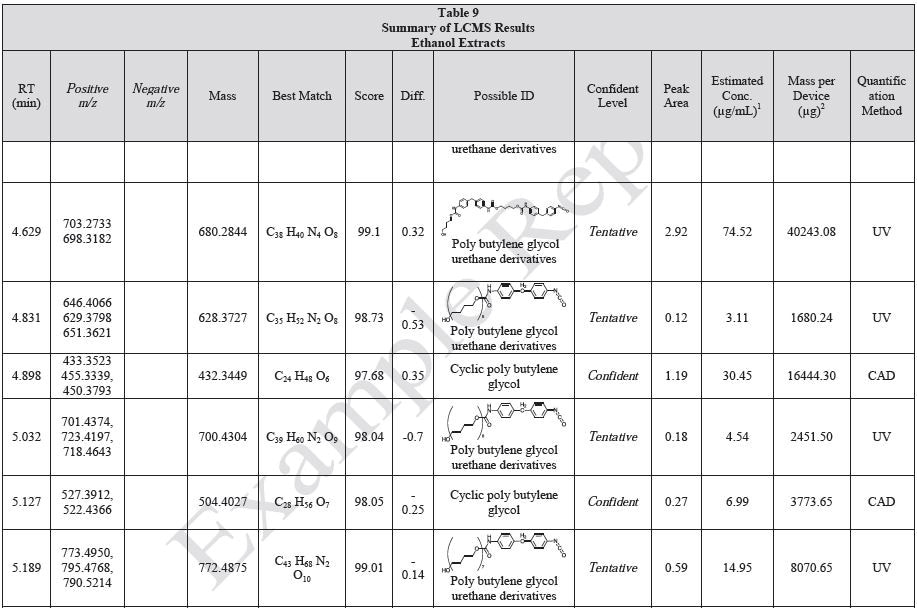
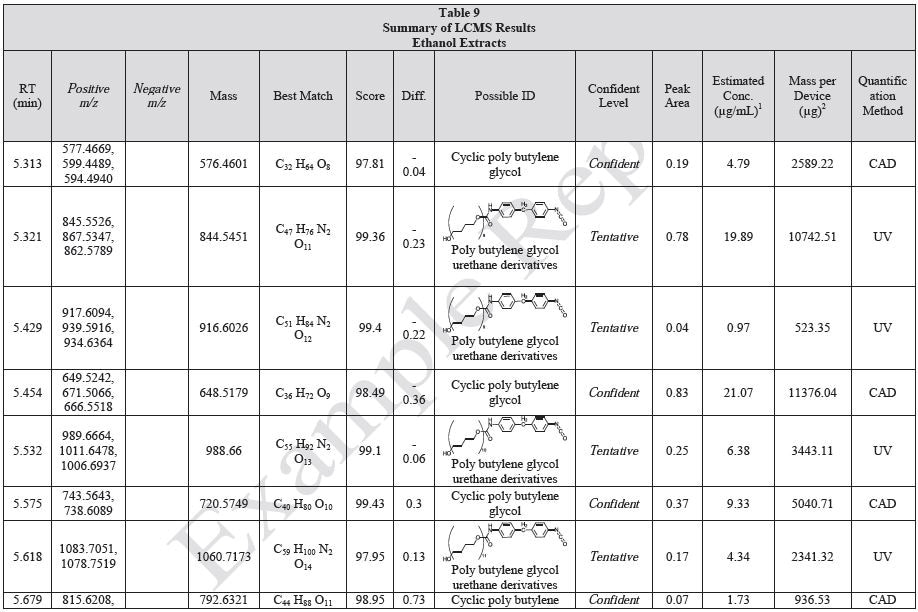
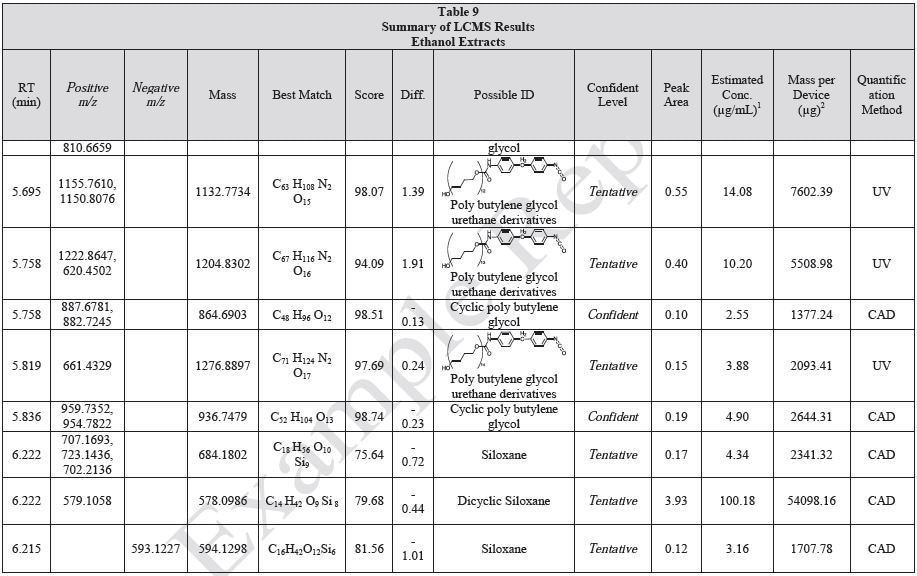
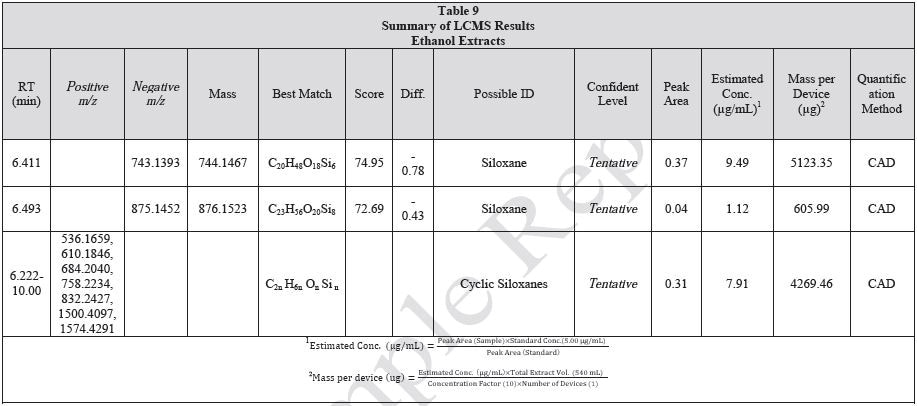
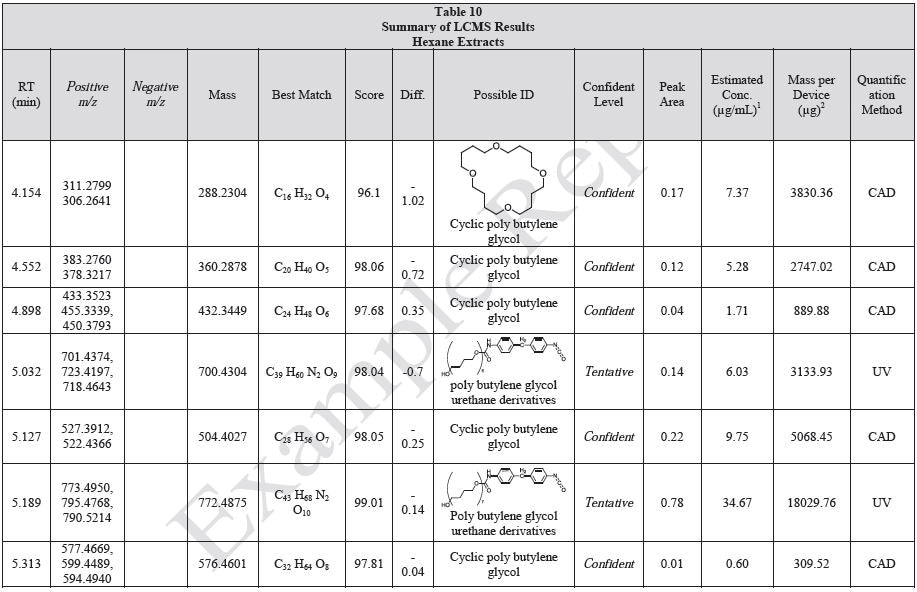
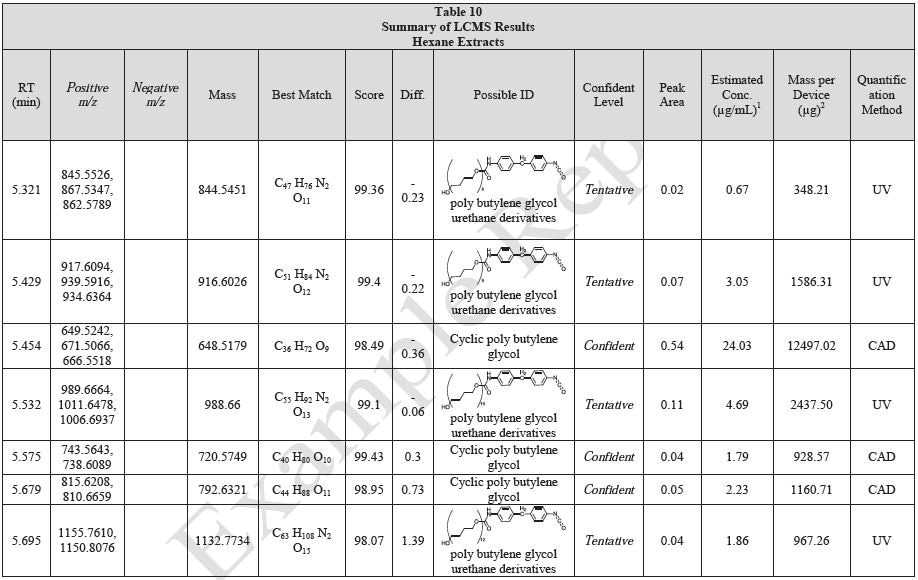
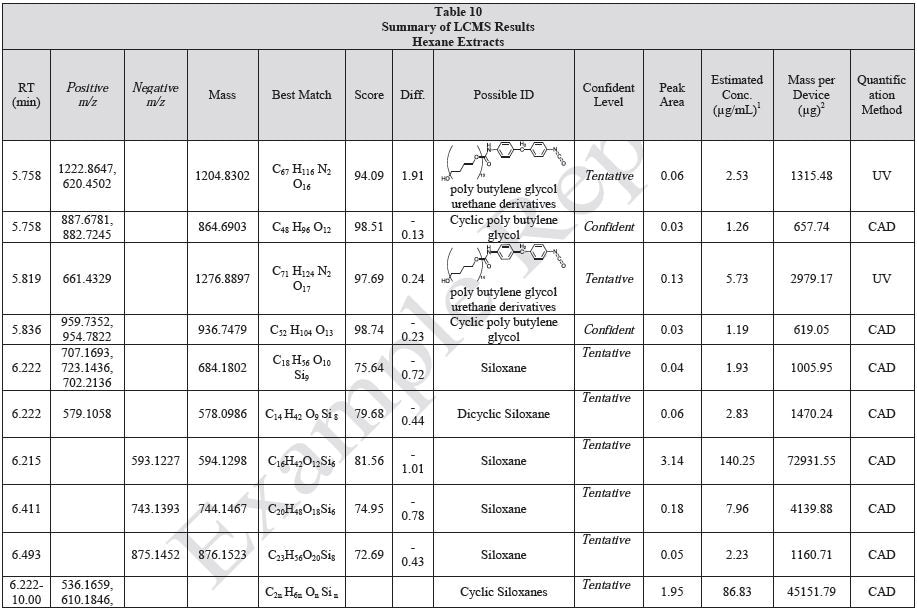

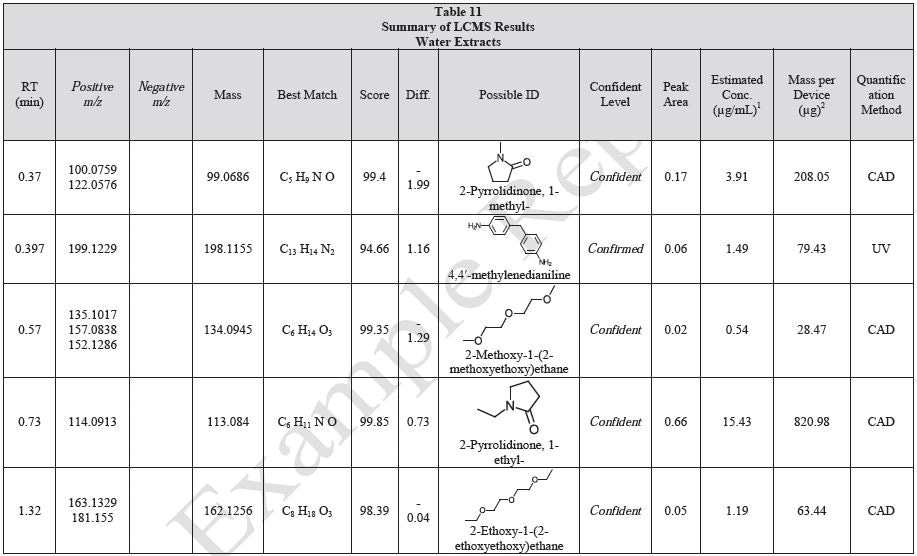
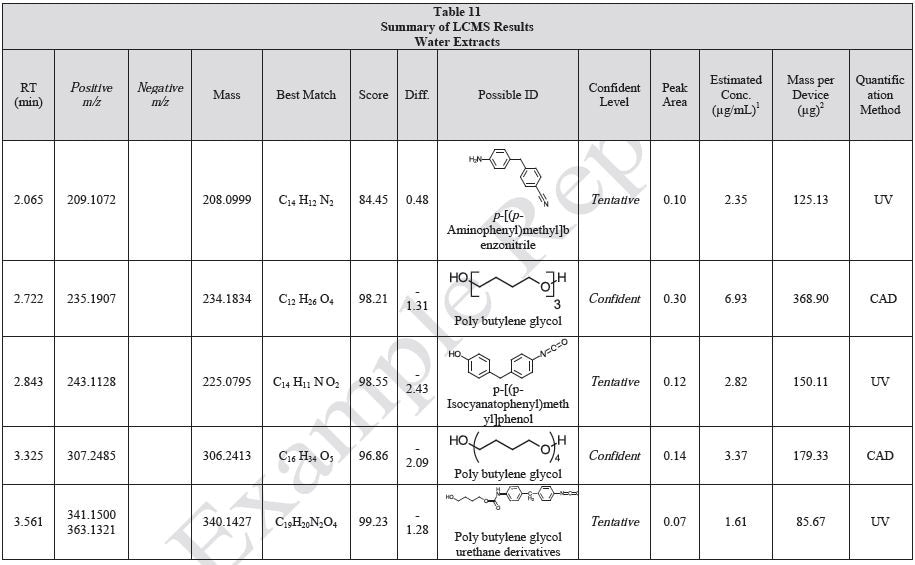
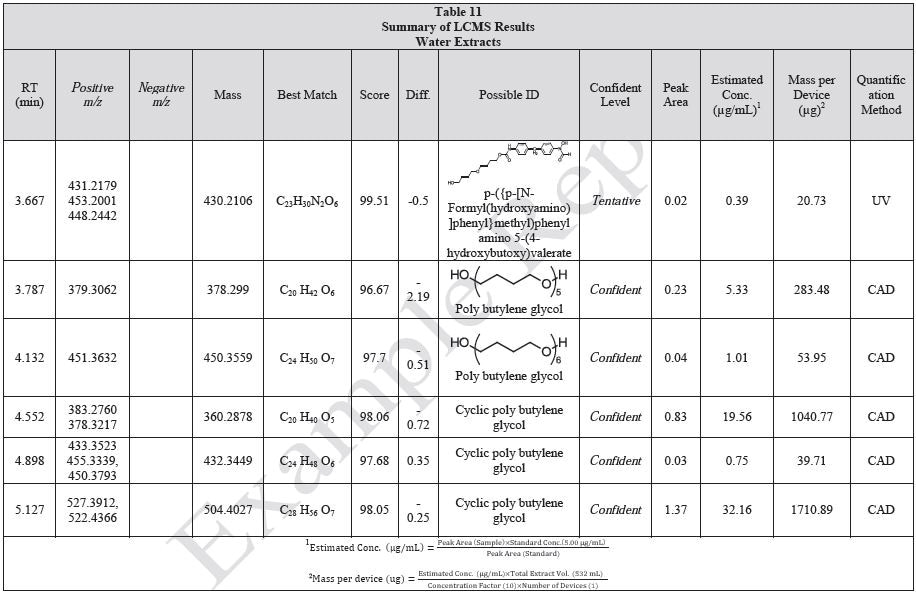
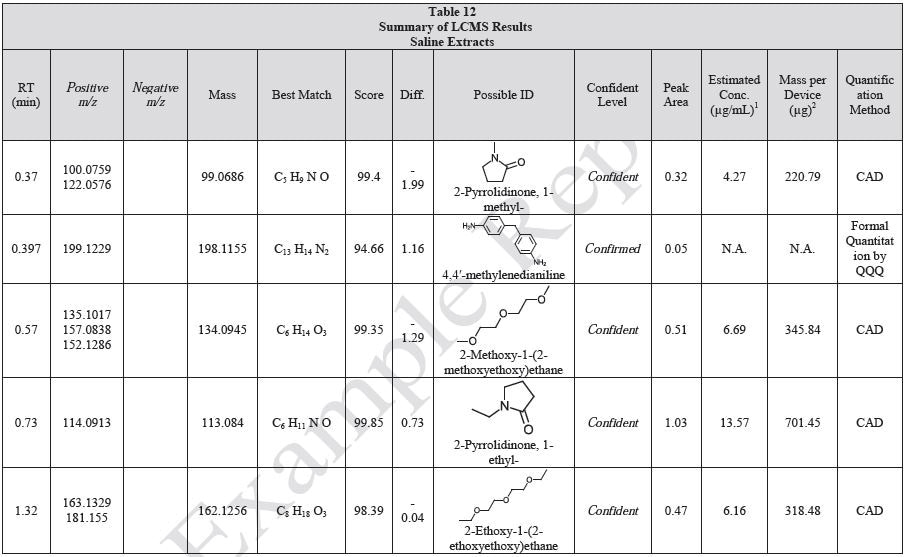
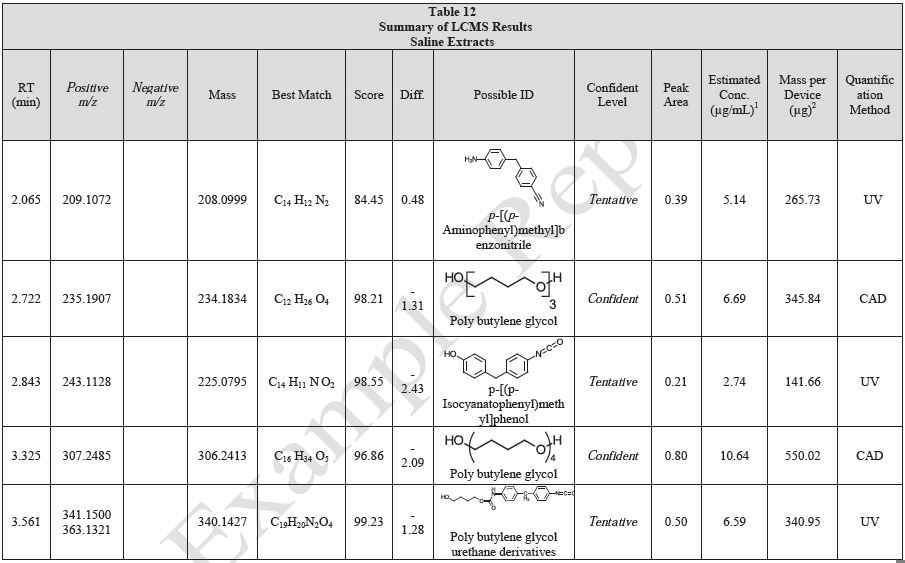
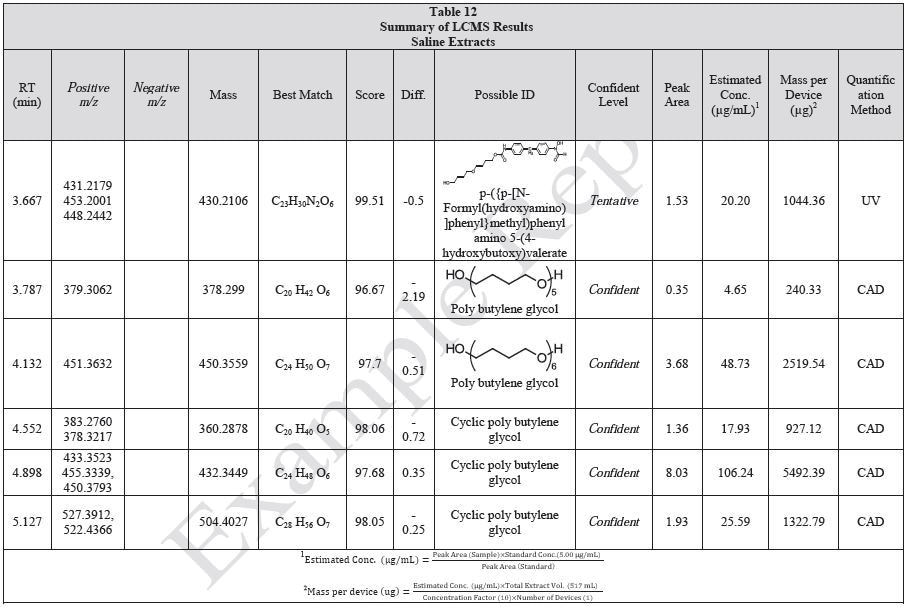
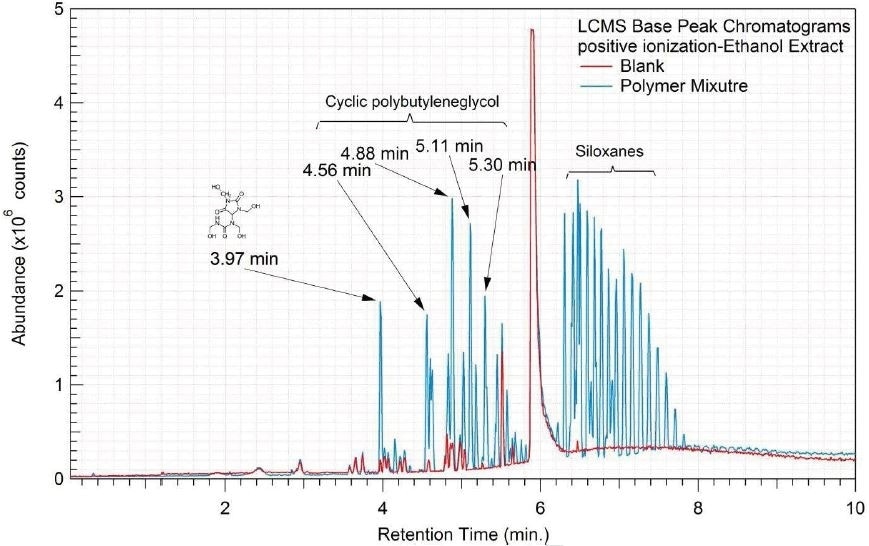
Figure 3. Overlay of LCMS base peak chromatograms of ethanol extract, positive ionization.
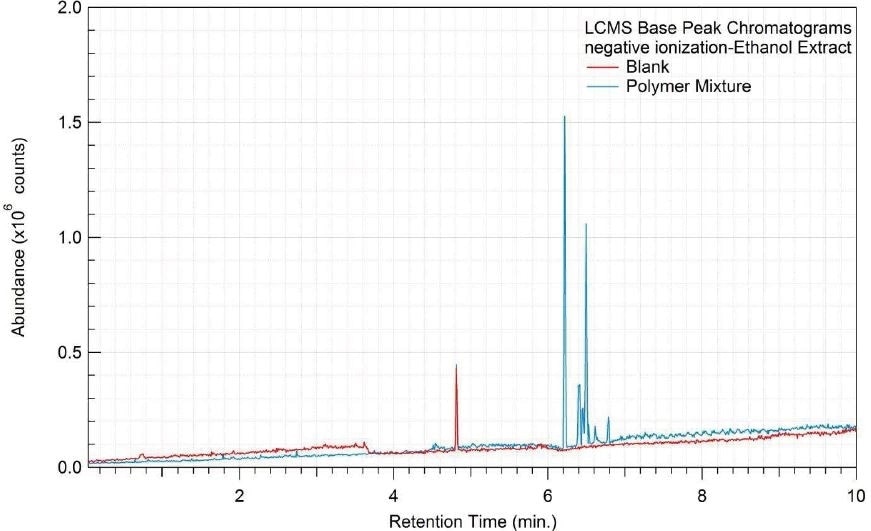
Figure 4. Overlay of LCMS base peak chromatograms of ethanol extract, negative ionization.
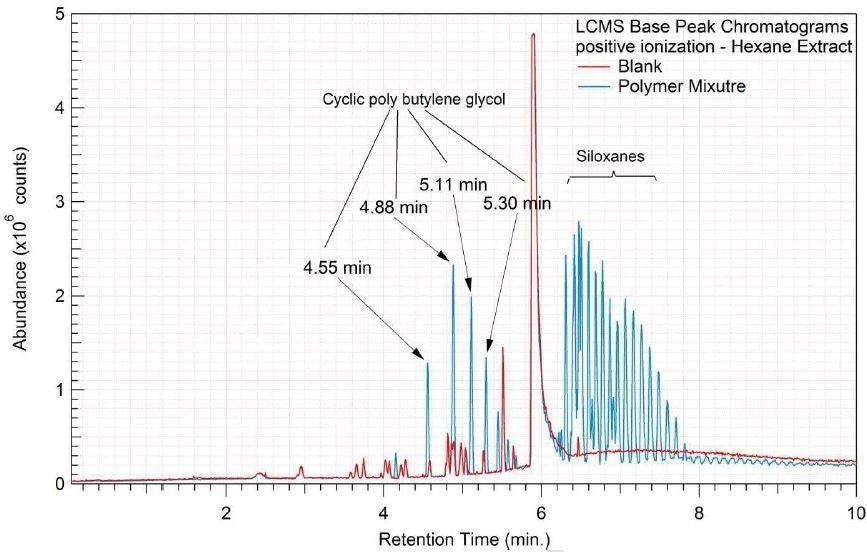
Figure 5. Overlay of LCMS base peak chromatograms of hexane extract, positive ionization.
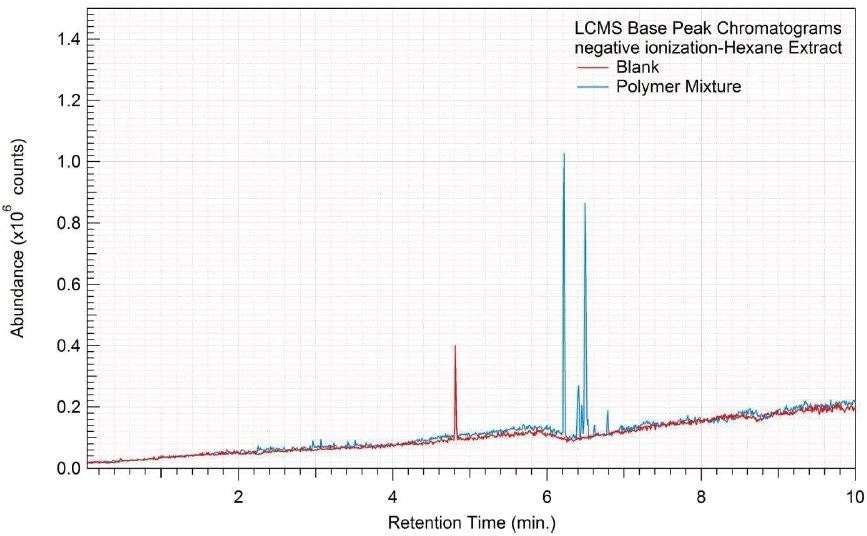
Figure 6. Overlay of LCMS base peak chromatograms of hexane extract, negative ionization.
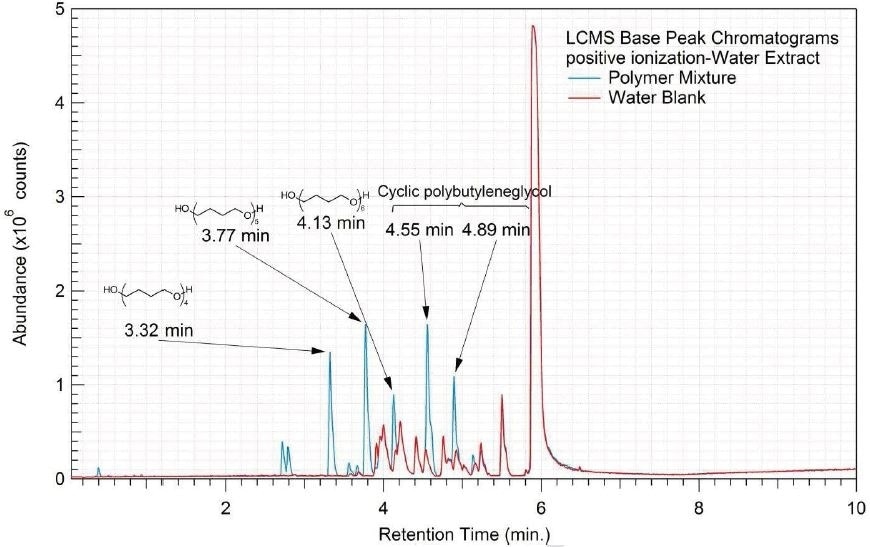
Figure 7. Overlay of LCMS base peak chromatograms of water extract, positive ionization.
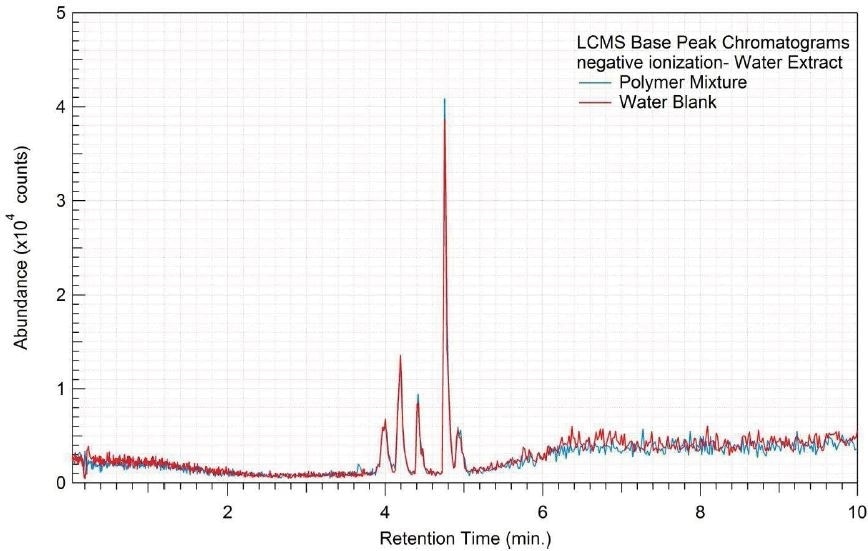
Figure 8. Overlay of LCMS base peak chromatograms of water extract, negative ionization.
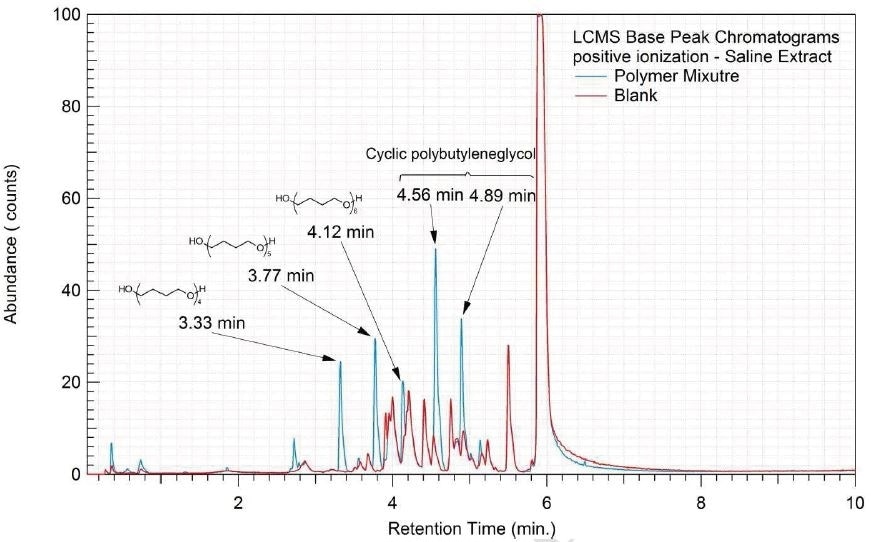
Figure 9. Overlay of LCMS base peak chromatograms of saline extract, positive ionization.
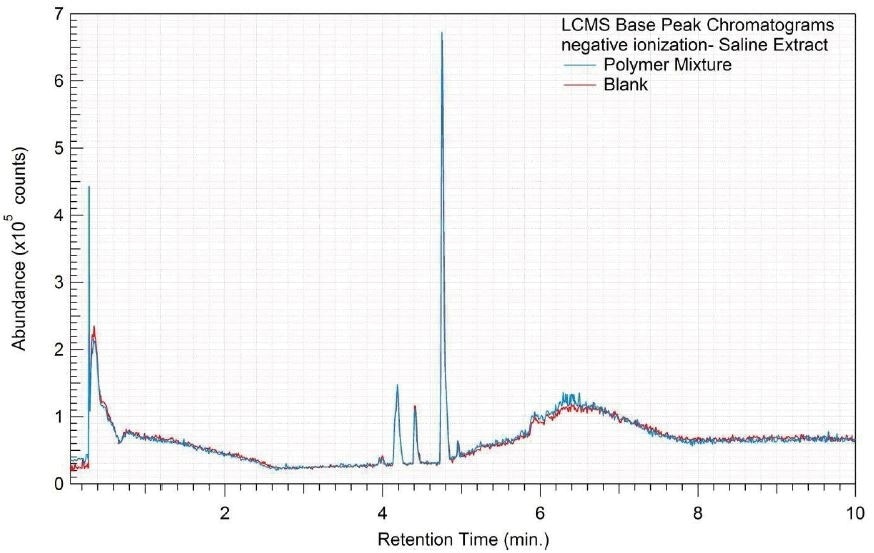
Figure 10. Overlay of LCMS base peak chromatograms of saline extract, negative ionization.
Formal Quantitation of 4,4'-methylenedianiline
The saline extract was analyzed by QQQ-LCMS to quantitate 4,4-methylenedianiline, and a five point calibration curve was prepared, as depicted in Figure 11. A 4,4-methylenedianiline standard was dissolved and then diluted to known concentrations in methanol from 20 ng/mL to 500 ng/mL. Each standard was injected in duplicate prior to and following the samples, and the averages of all four injections were used in developing the calibration curve. The resulting equation for the linear regression line and the R2 value for the line are highlighted in the figures. The LOQ for the method was found to be 20 ng/ml.
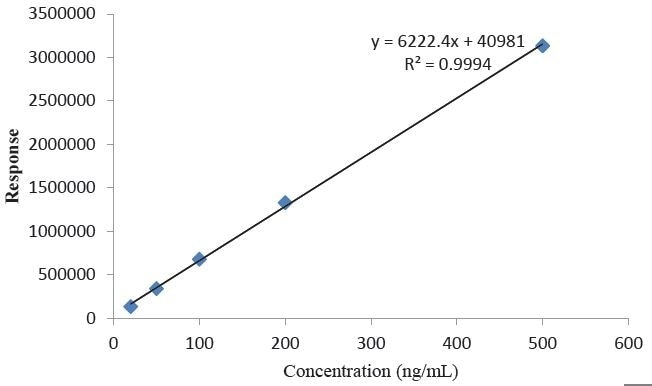
Figure 11. Calibration Curve for 4,4-methylenedianiline.
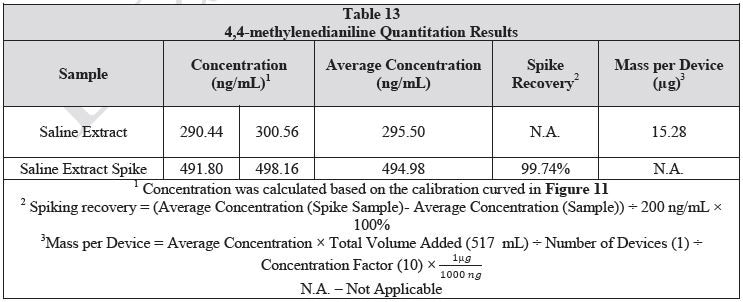
The saline extract was developed as detailed in the LCMS analysis section. For the spiked sample, 20 µL of 10 µg/mL 4,4-methylenedianiline standard was added to 1 mL of the extract. The samples were then examined in duplicate. Table 13 shows the results of the samples and the sample spike. The spike recovery was 97.24%.
QTOF GCMS
GCMS analysis was carried out in electron impact mode. It is possible to compare the spectra collected using electron impact (EI) ionization to the NIST mass spectral database for identification. Additionally, fragments can be identified using the accurate mass data collected. This ionization mode is high energy and usually causes a huge amount of analyte fragmentation. In many cases, the EI mass spectra collected only contains fragment ions making definitive unknown identification impossible for compounds not available in the mass spectral database.
Sample Preparation
10 mL of the saline and water extracts were individually extracted with 10 mL of DCM. The DCM solutions were concentrated to 1 mL under a mild stream of nitrogen and then examined by QTOF-GCMS. A 100 µL aliquot of the ethanol and hexane extracts were diluted to 1 mL with the extraction solvent and then analyzed by QTOF-GCMS.

 Please click here if you would like more information on the product in this article or a quote
Results
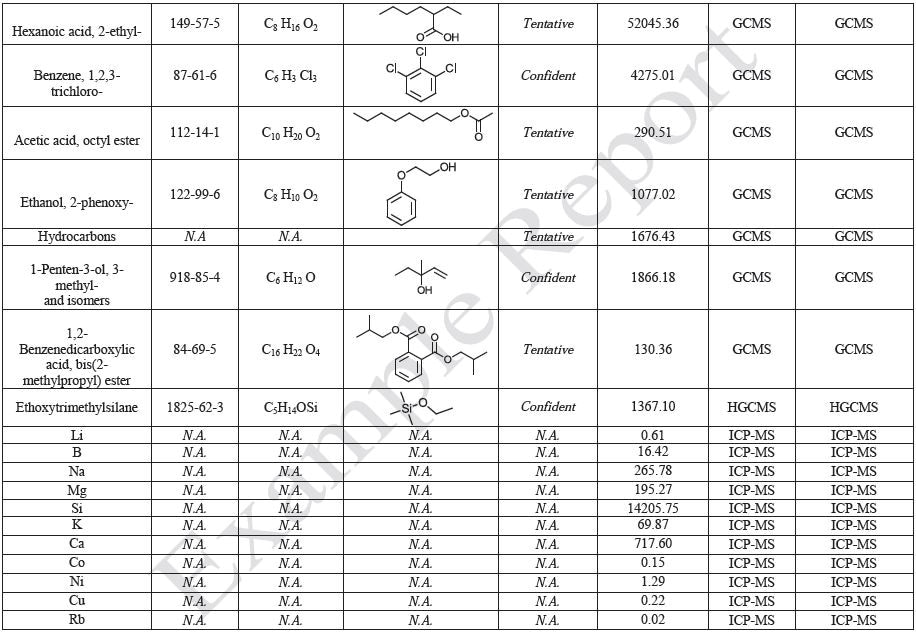
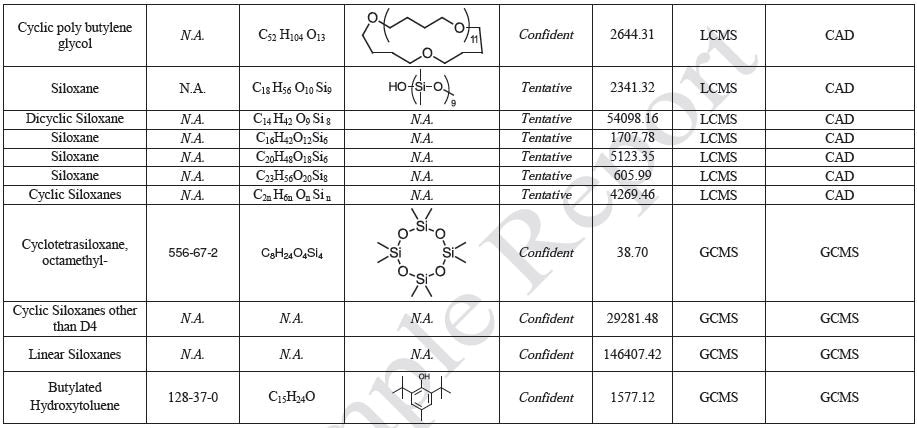
Tables 14-17 present a summary of the GCMS results for the sample extracts in ethanol, hexane, water and saline, respectively. Figures 12-15 provide overlays of the base peak chromatograms (BPCs) attained in positive and negative ionization modes, respectively.
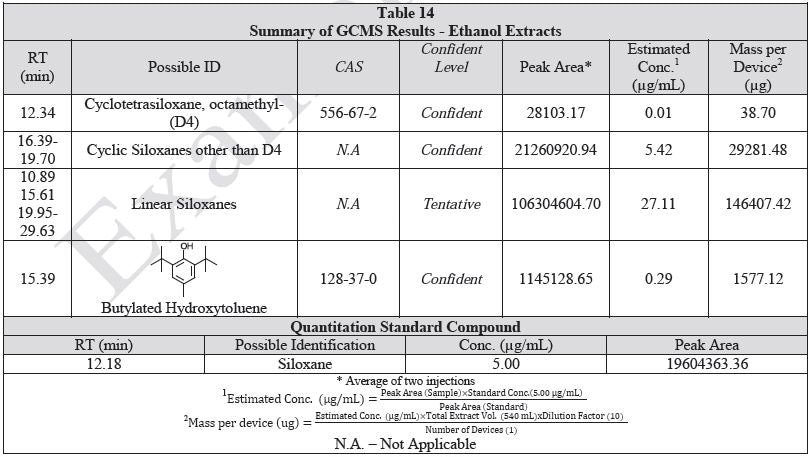
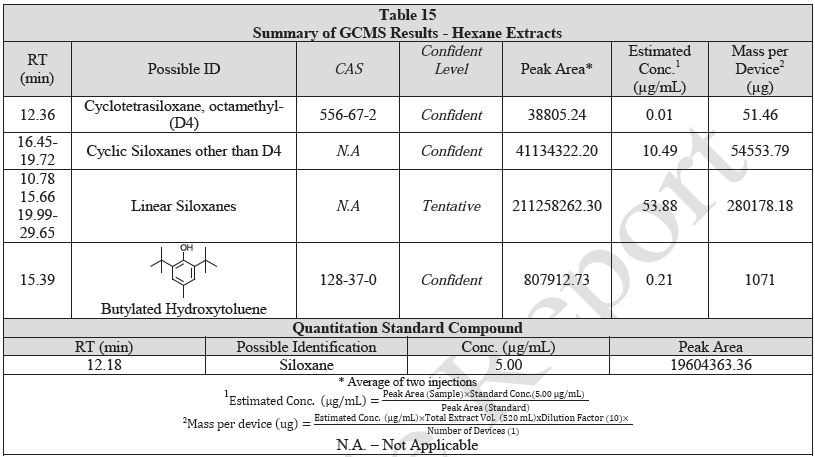
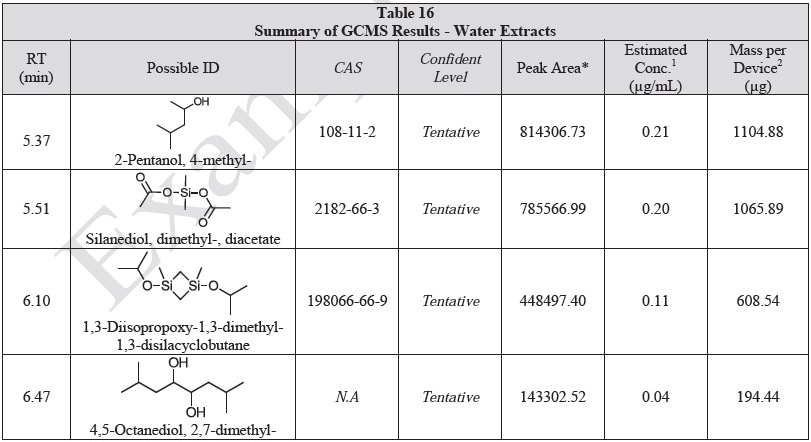
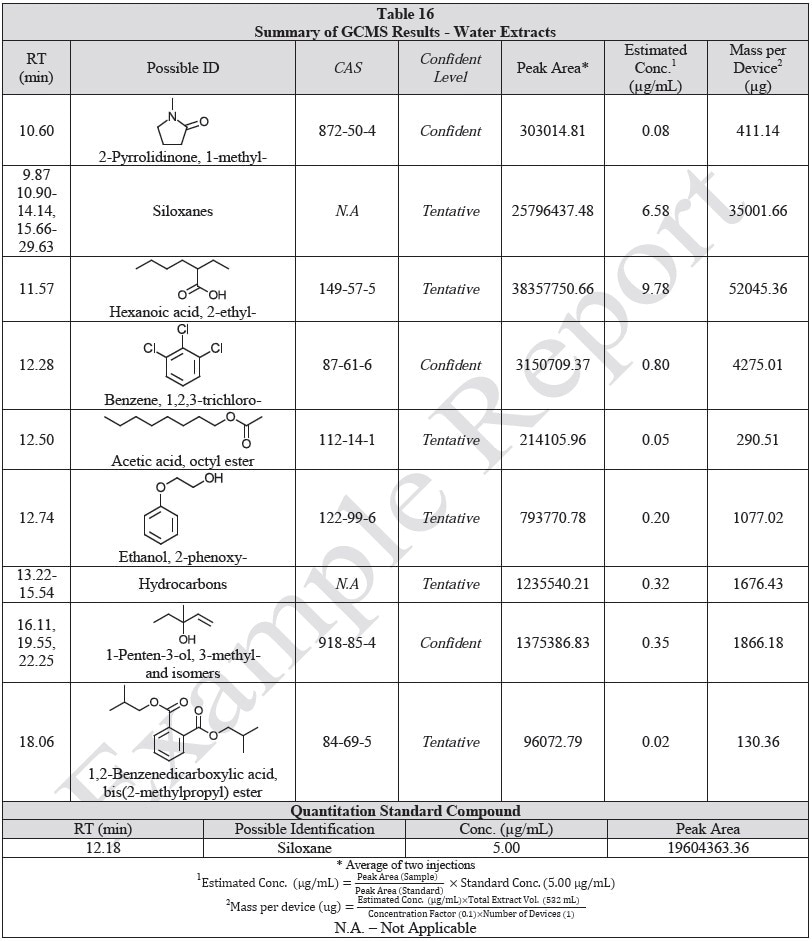
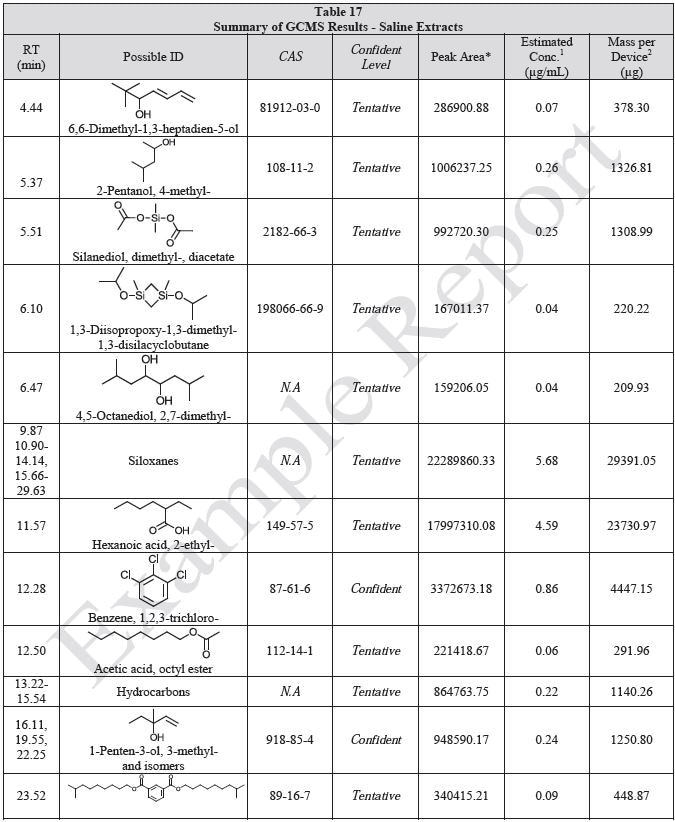
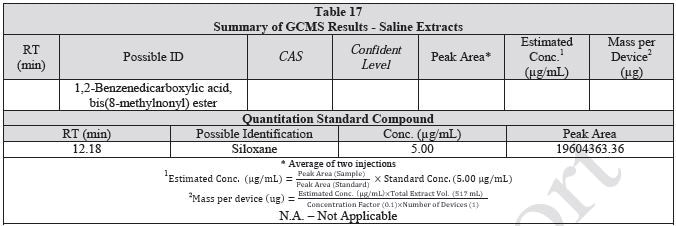
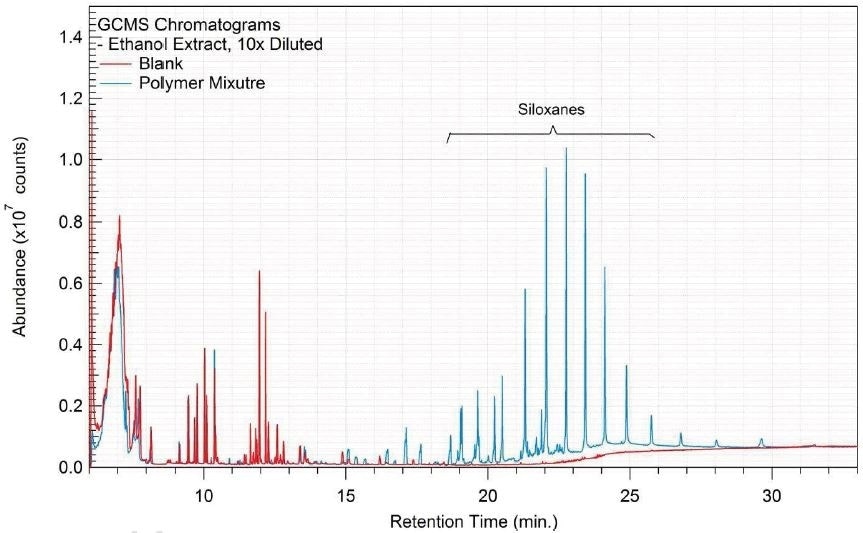
Figure 12. Overlay of GCMS chromatograms of ethanol extract.
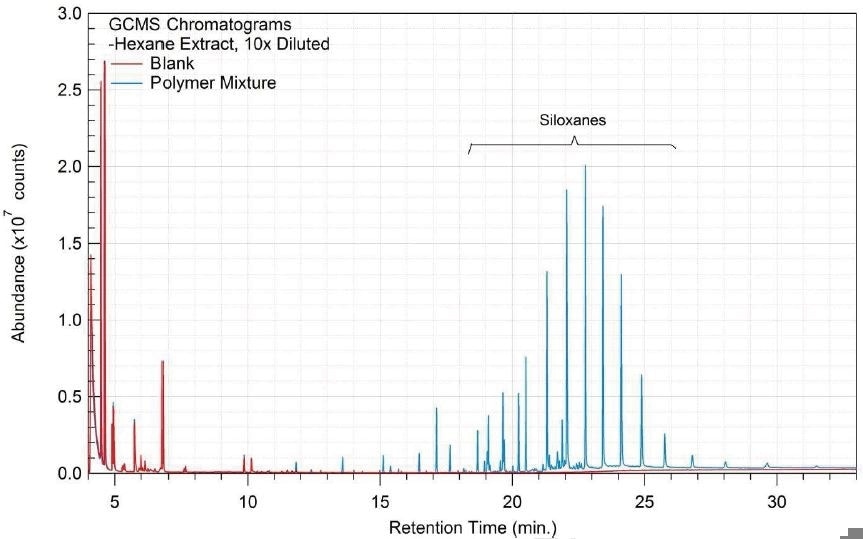
Figure 13. Overlay of GCMS chromatograms of hexane extract.
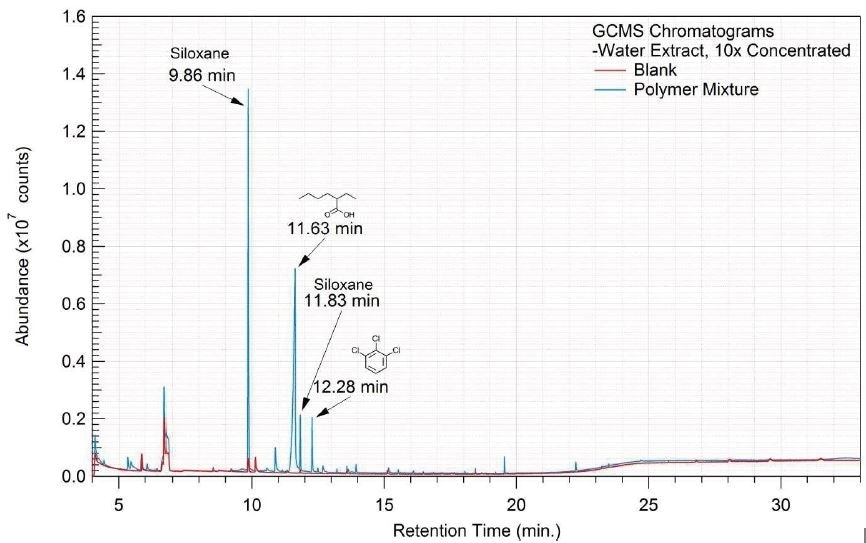
Figure 14. Overlay of GCMS chromatograms of water extract.
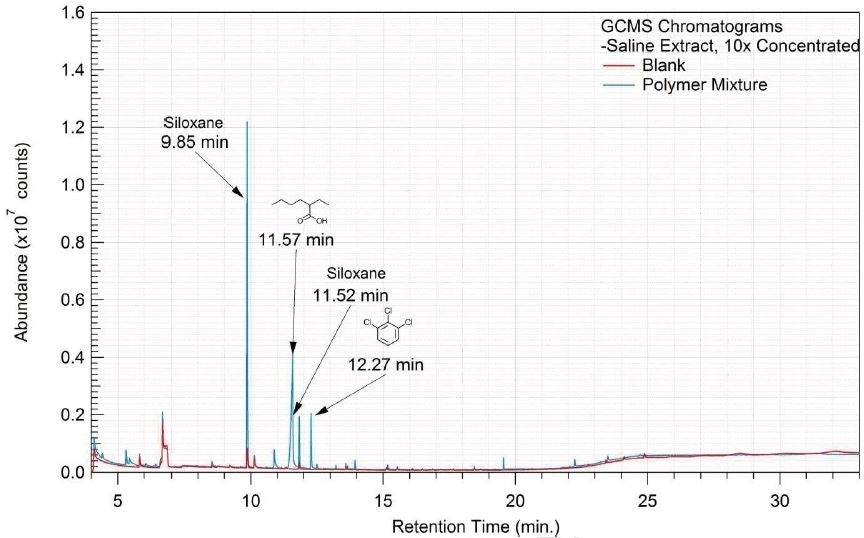
Figure 15. Overlay of GCMS chromatograms of saline extract.
HGCMS
A 1 mL aliquot of each sample of the water extract and saline extract was sealed in a 20 ml headspace sampling vial and analyzed on HGCMS. Figures 16-17 present overlays of the chromatograms collected from the blanks and samples. Tables 18-19 summarize the results.


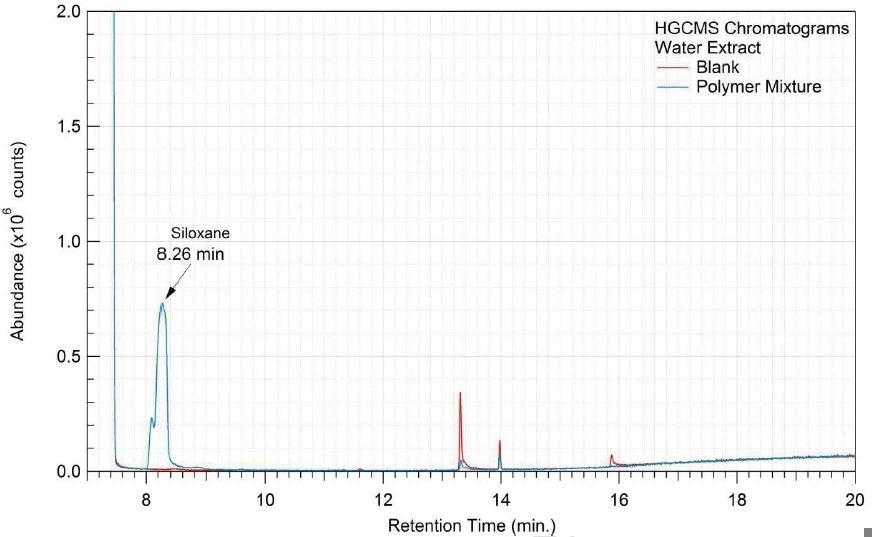
Figure 16. Overlay of HGCMS chromatograms of water extract.
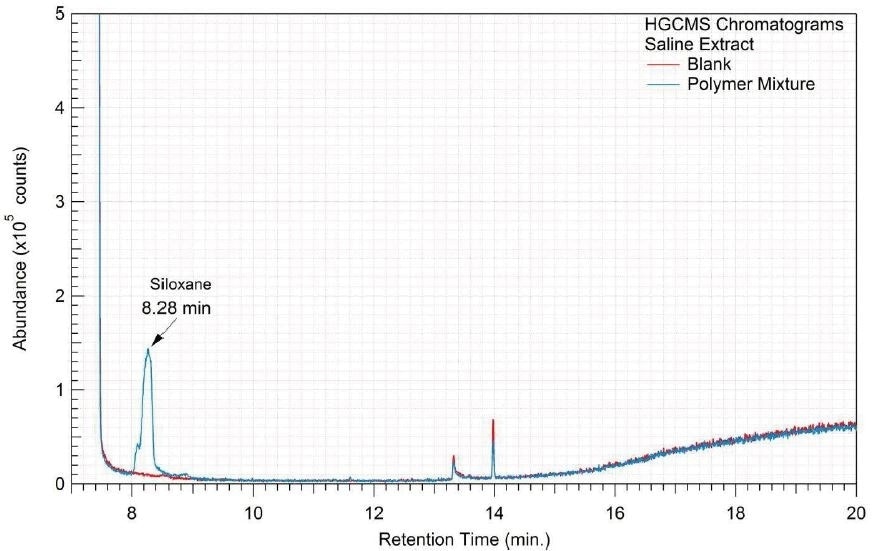
Figure 17. Overlay of HGCMS chromatograms of saline extract.
ICP-MS
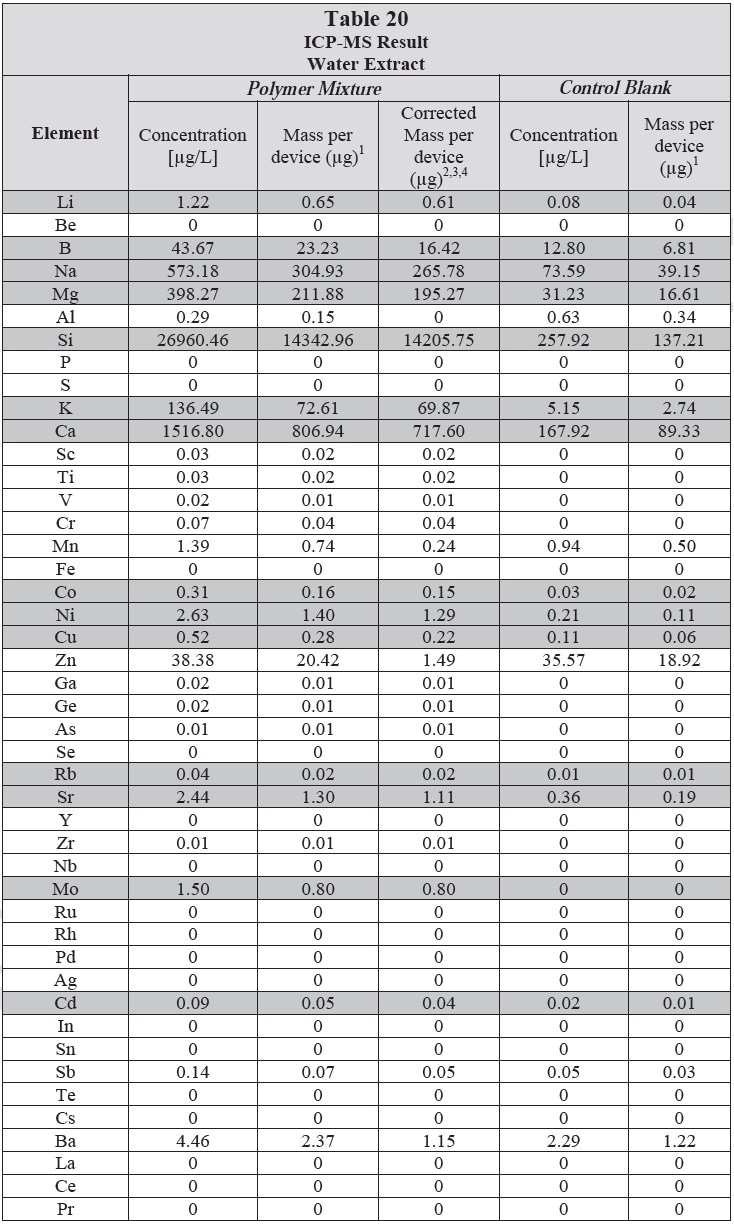
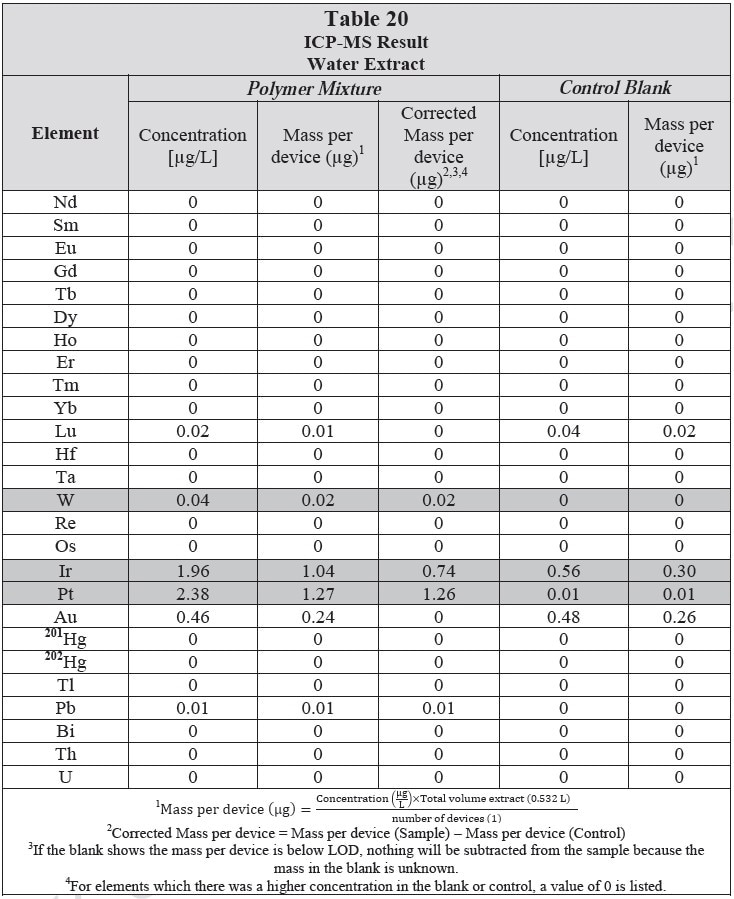
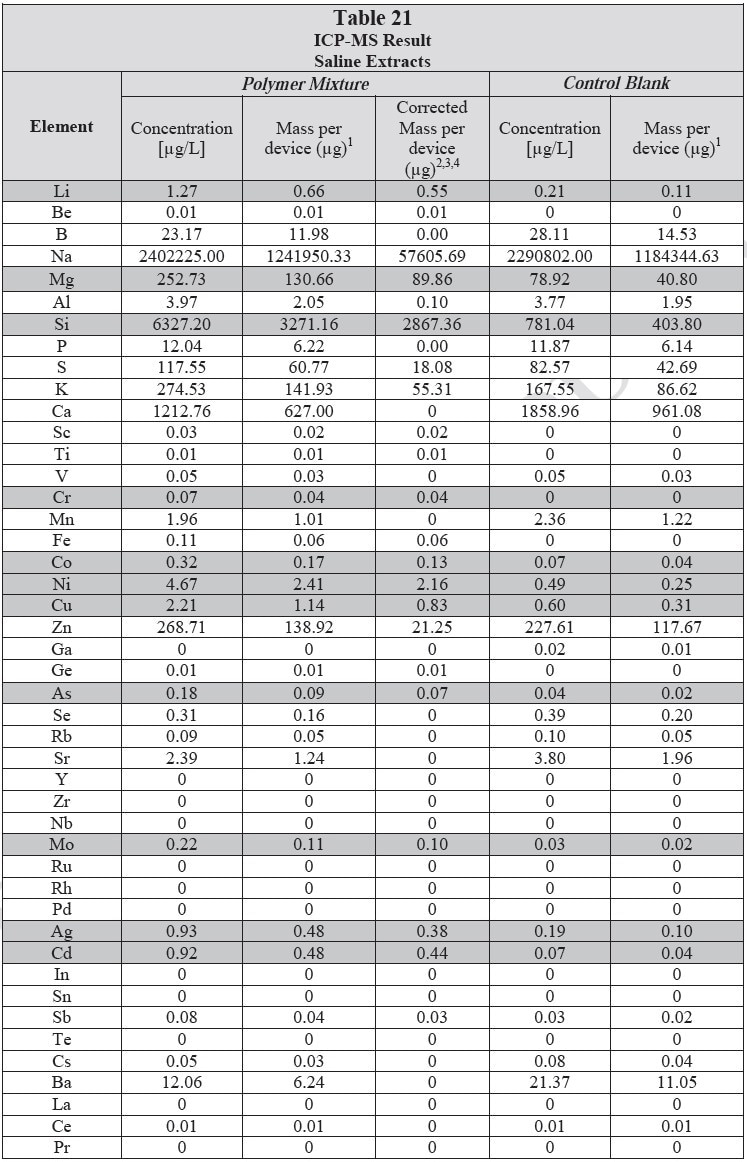
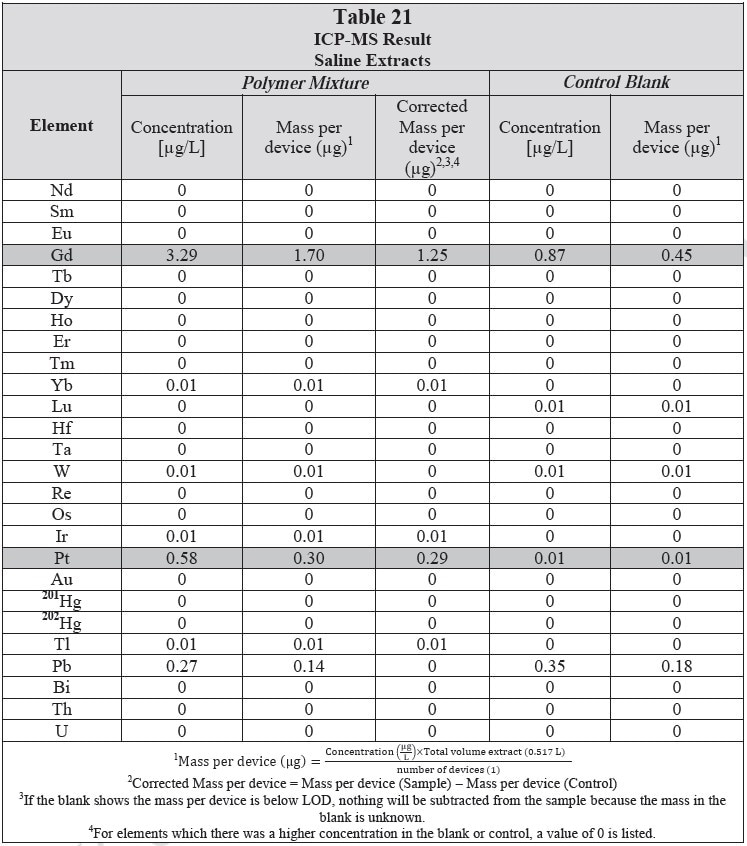
ICP-MS was used for 71 elements to determine the elemental composition of each extract. A control blank extract was examined at the same time as the samples. The control had been subjected to all of the same extraction and concentration steps as the samples. Elements detected in the blank and sample at similar concentrations are consistent with background components and thus the samples should not be considered a vital source of these elements. The amount observed in the blank is subtracted from that observed in the extracts for all calculations. A value of zero (0) is reported in cases where the blank showed higher concentration than the extract.
Elements which show a considerably higher level in one or more of the extracts (3x the background level) are highlighted.
Table 20 and Table 21 presents the results for the extracts in water and saline, respectively.
Analysis Conditions
FTIR
The Thermo Nicolet iN10 MX FTIR microscope was used to test the samples. Spectra were collected in attenuated total reflectance mode except where otherwise noted. The spectra produced were compared to ~ 23,000 entries in the library and the best match was determined based upon peak intensities and absorbencies.
QTOF LCMS
The following conditions were employed for the qualitative QTOF-LCMS analysis:
QTOF GCMS
The following conditions were applied for the qualitative QTOF-GCMS analysis:
Headspace GCMS
The following run conditions were used for Head Space analysis:
ICP-MS
The following run conditions were employed for ICP-MS analysis.

This information has been sourced, reviewed and adapted from materials provided by Jordi Labs.
For more information on this source, please visit Jordi Labs.