
An essential part of industrial product development is the manufacture of prototypes and initial samples, irrespective of whether the product is the complex part of an airplane or a simple screw. To fabricate single pieces, which are frequently rather small, in a production environment is generally a costly procedure. A special application field of powder metallurgy called additive manufacturing has developed in the past few years based on this cost-benefit calculation.
Additive manufacturing (AM) refers to the “process of joining materials in order to make objects from 3D model data.”1 AM generates objects layer upon layer from varied metal alloy powders or metal powders. The specifications of the manufacturing process are based on the possibilities and requirements of the user, and on the size and type of the object to be produced.
In recent years, several different methods have been established in the industry, such as:
Table 1. Additive manufacturing methods1.
| Rapid Prototyping |
Rapid Manufacturing |
Laser Beam Melting |
| Selective Laser Melting |
Selective Laser Sintering |
Direct Metal Laser Sintering |
| Electron Beam Melting |
Powder Bed fusion |
Freeform Fabrication |
| Solid Freeform Fabrication |
Laser Metal Deposition |
Laser Cladding |
| Direct Energy Deposition |
Direct Metal Deposition |
|
Most AM methods are based on the same procedure. A laser beam locally melts the upper powder layer which solidifies and produces a layer of solid material. This is repeated layer by layer until the final object is produced. The quality of the unused powder is established by particle size analysis (sieving), and in certain cases also by elemental analysis, before it is returned to the manufacturing process.
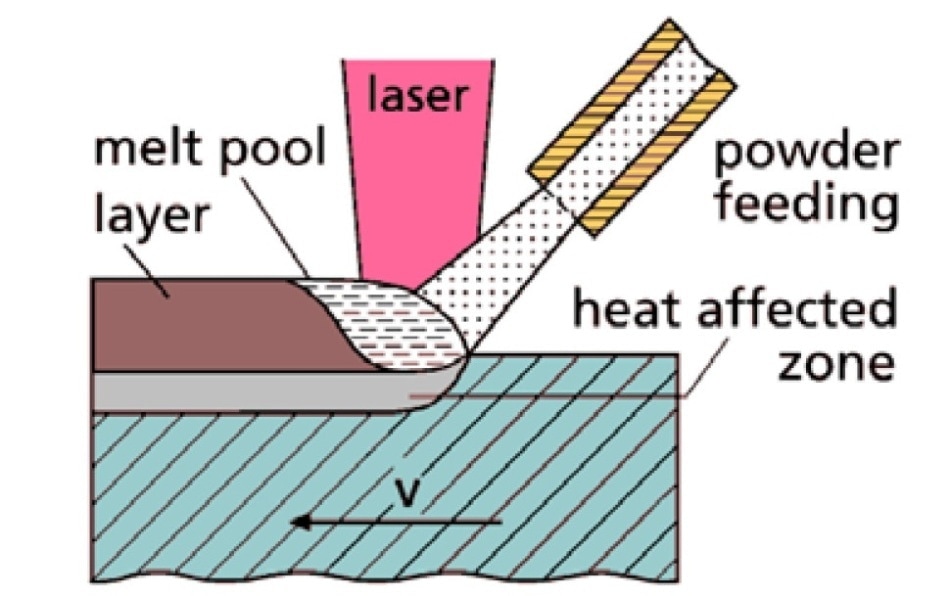
Figure 1. Additive manufacturing by Laser Metal Deposition.1
Quality Control Process
Additive manufacturing is currently becoming a well-established production technology. However, as it is still new, the desired process steps have not been uniformly defined yet. There are, for instance, no industry-wide standards describing the quality control process. The particle size distribution of the powder used for AM is an established parameter. However, particle size should not be the only characteristic employed for quality control.2
Additive manufacturing is currently becoming a well-established production technology. However, as it is still new, the desired process steps have not been uniformly defined yet. There are, for instance, no industry-wide standards describing the quality control process. The particle size distribution of the powder used for AM is an established parameter. However, particle size should not be the only characteristic employed for quality control.2
Elements Which Have an Influence on the Material Properties
Steel
There are a number of elements which influence the properties of steel with carbon at the top of the list. Steel is classified into different quality grades and application fields, based on the type and concentration of these alloy elements (C, Si, P, S, Mn, Cr etc.). In the following the extremely vital non-metallic elements and their effects are described.
Carbon [C]: The carbon content affects different physical parameters of steel. This ferrous alloy comprises of carbon ranging between 0.0002% and 2.06%. An increase in the carbon content leads to a lower melting point. Furthermore, hardness and brittleness increase with the carbon content.
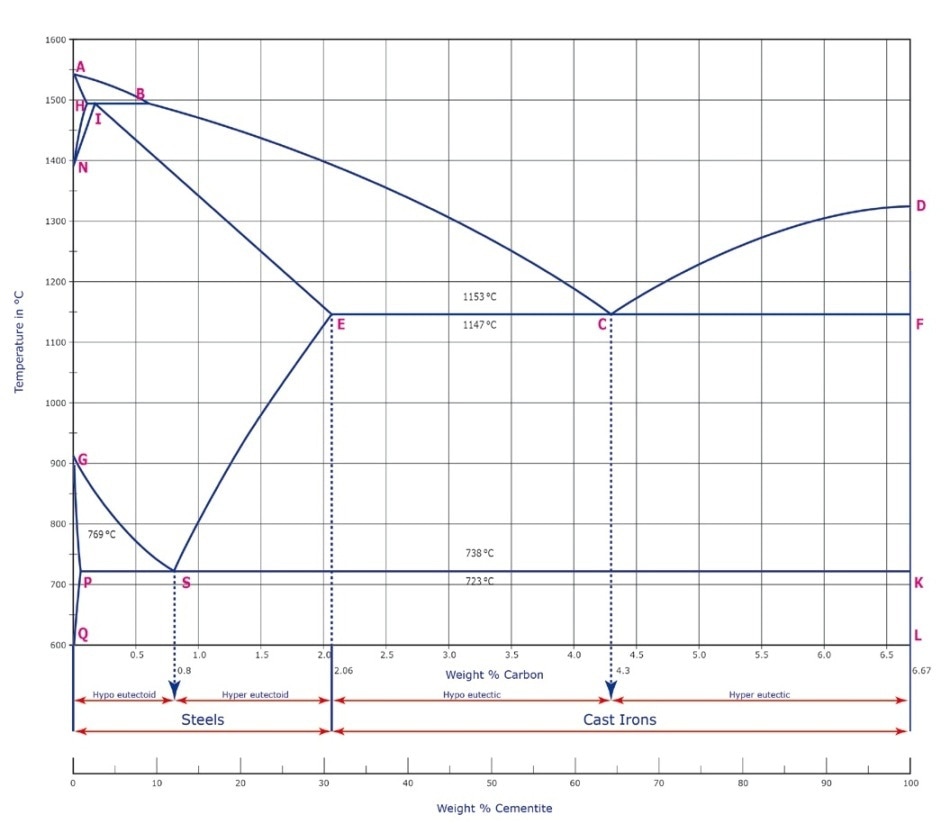
Figure 2. Iron-carbon phase diagram.
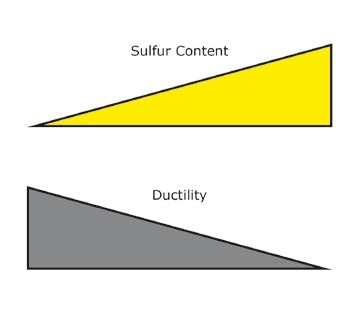
Sulfur [S]: If the alloy comprises of sulfur, this increases the machinability of the steel, i.e. the material’s suitability for being treated by methods like milling or drilling. The higher the sulfur content, the lower the ductility.
Nitrogen [N]: The nitrogen content can be divided into undesired and desired content. There are some exceptional applications which allow a high nitrogen concentration. In these cases its chemical form has to be considered. Nitrogen in its elemental form is localized along the grain boundaries and influences the ductility of steel in a major way. The nitrogen content which is bound to other elements is generally not considered important.
Oxygen [O]: Oxygen is a so-called steel parasite since it makes the steel brittle and causes ageing brittleness.
Hydrogen [H]: Hydrogen in steel causes degrading of the mechanical stability. Hydrogen embrittlement is extensively feared as it may cause substantial economic and technical damages. It means that the protons fasten themselves to the metal matrix which could develop cracks in the steel.
Titanium
Hydrogen [H]: Has the same effect on titanium as on steel. Hydrogen may impact the formation of mixed phases in titanium alloys.
Nitrogen [N]: Nitrogen increases the brittleness of titanium.
Oxygen [O]: Even minimum amounts of oxygen have a significant effect on the hardness or toughness of titanium. The Specification Book shows that even small differences in the oxygen content may be able to determine the difference between low-quality titanium (grade 3: 0.35%) and high-quality (grade 1: 0.18% O). Oxygen changes the physical and mechanical properties of titanium significantly. Titanium with an oxygen concentration of 0.1% is approximately three times more stable than with a concentration of 0.3%.
Sulfur [S]/Carbon [C]: These elements only have a very slight effect on titanium.
The determination of the described element concentrations should be performed before and after the additive manufacturing process in order to guarantee that both the raw materials and the final product possess the desired quality.
Analysis Methods
There are different ways of measuring element concentrations and impurities, most of which require destruction of the sample. This is done to guarantee that all relevant components of the analyzed sample are properly released.
Combustion analysis provides a number of benefits. It is possible to measure the samples in solid form, meaning direct measurement without previous treatment. The average particle size needed for metal powders used for additive manufacturing processes lies between 5 µm and 150 µm. This is determined by particle size analysis, for example by Dynamic Image Analysis. If the powder has the right size distribution it can be examined for elemental concentrations by combustion analysis.
The measurement of H/C/N/O/S cannot be performed in one single analysis. Nitrogen, oxygen and hydrogen are analyzed in one step and carbon and sulfur in another.
This is due to different methods being applied:
O/N/H Analysis
The sample is dropped into a graphite crucible and melts because of the high temperature. Consequently, nitrogen, oxygen and hydrogen are released. Oxygen transforms to CO on the surface of the hot crucible. The gases from the crucible are removed by the inert carrier gas.
A copper oxide catalyst transforms CO to CO2 which is detected in the infrared cells. An infrared ray with a particular wave length is used for exciting the carbon dioxide molecules. The loss of energy, which was transferred to kinetic energy, is used for determining the exact oxygen concentration of the sample. The hydrogen and nitrogen content are measured in a thermal conductivity cell.
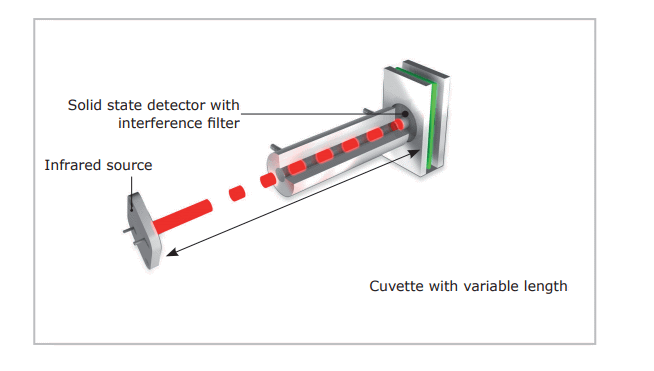
Figure 3. Infrared cell.
The ELEMENTRAC thermal conductivity cell is based on a micromechanical silicon chip which is attached to a membrane and operates independently of a reference gas flow. If the thermal conductivity of the gas changes, for example if nitrogen is discharged from the sample, the heating capacity needed for heating the membrane also changes. This is specified by a measuring signal. The method is sensitive and robust, and it ensures stable measuring results over a wide concentration range.
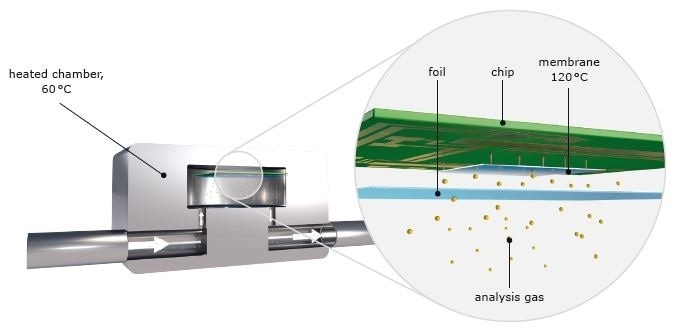
Figure 4. Thermal conductivity cell.
Table 2. Different thermal conductivities.
| |
M
[g/mol] |
Density
[kg/m3] |
Coefficient of thermal
conductivity [W/kW][1] |
| Hydrogen H2 |
2.02 |
0.08987 |
1.869 |
| Helium He |
4.00 |
0.17839 |
1.567 |
| Nitrogen N2 |
28.01 |
1.2505 |
0.260 |
| Argon Ar |
39.94 |
1.7839 |
0.179 |
[1] CRC Handbook of Chemistry and Physics, 1995-1996, 76th Edition
Table 3 shows typical results for a simultaneous oxygen and nitrogen analysis of a steel sample. Reproducibility is clearly below 1 ppm, even for very low concentrations.
Table 3. Measurement of Eltra 91100-1001 #714A.
| Weight [mg] |
Oxygen [ppm] |
Nitrogen [ppm] |
| 994.9 |
6.1 |
18.8 |
| 999.0 |
5.1 |
18.0 |
| 1000.2 |
5.7 |
17.8 |
| 997.6 |
6.3 |
18.4 |
| 1000.4 |
6.9 |
18.6 |
| 997.4 |
5.9 |
17.8 |
| 997.5 |
7.1 |
19.4 |
| 994.7 |
5.6 |
18.4 |
| 996.9 |
5.6 |
19.4 |
| 998.1 |
5.8 |
18.4 |
| Mean value |
6.0 |
18.5 |
| Deviation / relative deviation |
±0.6 / 10.3% |
±0.6% / 3.1% |
C/S Analysis
In the induction furnace, the sample is melted in a pure oxygen atmosphere, causing sulfur to react to sulfur dioxide (SO2) and carbon to react to a mixture of carbon dioxide (CO2) and carbon monoxide (CO).
The combustion gases pass through a dust filter and moisture absorber for purification. In the next step, the sulfur dioxide is identified in infrared cells. In ELTRA’s CS-800, it is possible to adapt infrared cells with different sensitivities (high/low) according to the user’s requirements. Oxidation of both, carbon monoxide to carbon dioxide and sulfur dioxide to sulfur trioxide follow the sulfur measurement. The SO3 gas is removed with cellulose wool; the carbon content is identified by infrared cells which allow for individual customization. ELTRA analyzers can be equipped with up to four independent infrared cells.

Figure 5. Carbon/sulfur analysis procedure.
The sample is weighed in a crucible and then covered with tungsten for analysis. Table 4 displays a typical result for a steel sample.
Table 4. Measurement of AR 875 #51256.
| Weight [mg] |
Carbon [%] |
Sulfur [ppm] |
| 1002.8 |
0.8627 |
100.11 |
| 1001.5 |
0.8655 |
100.60 |
| 998.9 |
0.8662 |
104.47 |
| 1000.3 |
0.8571 |
101.52 |
| 1002.3 |
0.8676 |
105.03 |
| 1000.8 |
0.8641 |
106.54 |
| 1005.5 |
0.8627 |
107.78 |
| 1001.7 |
0.8716 |
99.89 |
| 1002.0 |
0.8671 |
103.09 |
| 1001.7 |
0.8627 |
104.35 |
| Mean value |
0.862 |
104.35 |
| Deviation / relative deviation |
±0.0037 / 0.43% |
±02.29 / 2.21% |
Conclusion
Non-metallic elements such as hydrogen, carbon, oxygen, sulfur and nitrogen influence the physical properties of metallic materials. These elements may be found in the powdered raw materials employed for additive manufacturing, or they could also be introduced during the production process. Thus, detailed quality control should always focus on analysis of the raw material and the final product. Combustion analysis provides reliable and convenient solutions to reproducibly measure element concentrations in a range from a few ppm to percentages.
References and Further Reading
- Introduction to additive manufacturing technology, www.epma.com/am
- Berumen, S.; Bechmann, F.; et al, Quality Control of laser and powder bed-based Additive Manufacturing (AM) technologies, Physics procedia, 5, 617-622, LANE 2010

This information has been sourced, reviewed and adapted from materials provided by ELTRA GmbH.
For more information on this source, please visit ELTRA GmbH.