Alongside cellulose, chitin is one of the most plentiful biopolymers on the planet. Chitin, also known as poly-N-acetyl-glucosamine, derives from fungi and yeasts, and is also the principal polymer in the exoskeleton of marine arthropods. It is utilized in water treatment, photographic emulsions and dyeing enhancement of synthetic fibers and fabrics.
Chitosan is deacetylated chitin, that can be acquired from shrimp or crab shells. Its functions range from the therapeutic, including wound healing, to dietary supplements and cosmetics. For a number of these functions, it is advantageous to comprehensively define the molar mass moments and distributions of the chitosan products.
Size-exclusion chromatography, in collaboration with multi-angle light scattering detection (SEC-MALS), offers a simple technique to identify these features in an absolute way, independent of molecular references. This article describes the outcomes for two chitosan samples examined by SEC-MALS.
Materials and Methods
A Wyatt DAWN® MALS detector and Optilab® differential refractive index (dRI) detector were probed downstream of the GPC column. Data acquisition and investigation were carried out in the ASTRA® software utilizing empirically-determined differential refractive index increments (dn/dc). Polymer molar mass M was measured at each elution volume with the use of signals from both detectors.
The differential refractive index is a feature of the polymer/solvent structure. It is calculated by injecting a sequence of established concentrations into the Optilab. This process implements solutions that are typically made using the dry weight method, to ensure precision, and the SEC mobile phase as solvent. ASTRA gathers and interprets the results to ascertain dn/dc.

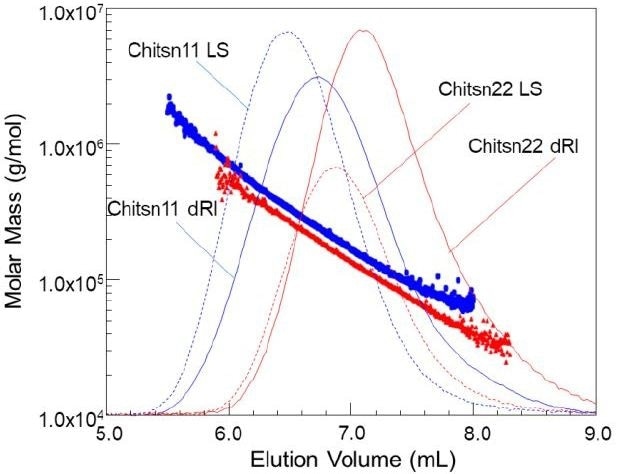
Figure 1. Molar Mass vs. elution volume plots superimposed over chromatograms for two chitosans.
Results and Discussion
The molar masses of two chitosan samples were correlated as a function of elution volume in Figure 1. The molar mass depreciates in a logarithmic manner, signifying the optimal nature of the chromatographic conditions. Any offset in elution volume for a stated molar mass might be a consequence of conformation (short-chain branching, SCB), or alternatively of non-ideal analyte-column interaction.
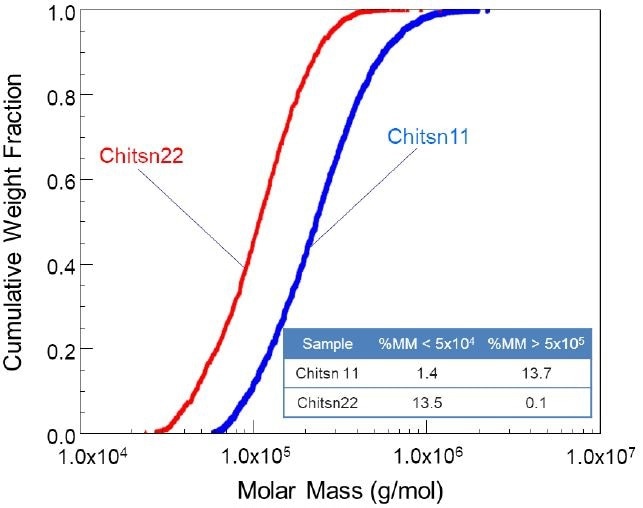
In addition, SCB can be analyzed by implementing simultaneous size (radius of gyration, Rg) and molar mass analysis with MALS. A cumulative molar mass distribution plot, described in Figure 2, explicitly distinguishes the two chitosan samples.
Moreover, ASTRA software can disclose weight fractions above, below, or between the selected molar masses. To illustrate this, the weight fraction of molar masses less than 50 kDa and more than 500 kDa for these samples are provided in the chart in Figure 2. These measurements and the cumulative molar mass distribution plot are perfect when it comes to quality control processes.

Figure 2. Cumulative molar mass distribution plot of two chitosan samples with quite different spans.
Conclusions
The results depicted in this article indicate that MALS detection, in collaboration with SEC, offers an invaluable technique for the characterization of biopolymers. Absolute molar mass and molar mass distributions can be efficiently acquired, and there is no associated requirement for any standards or empirical relations. For chitosan-based products, SEC-MALS not only streamlines QC and everyday analyses, but also improves more detailed analysis, providing absolute measurements of size and conformation, in addition to molar mass.

This information has been sourced, reviewed and adapted from materials provided by Wyatt Technology.
For more information on this source, please visit Wyatt Technology.