Hyaluronic acid is a naturally derived, unbranched polysaccharide that comprises consecutively recurring D-glucuronic acid and N-acetylglucosamine units.

Image Credit: Corona Borealis Studio/Shutterstock.com
This biopolymer exists in all mammalian systems but appears mainly in synovial (joint) fluid, vitreous humor, and numerous loose connective tissues, such as rooster comb.1
Hyaluronic acid is prominent in ophthalmic, medical, pharmacological, and cosmetic applications.

Figure 1. Hyaluronic acid is a natural polymer important in biology and commercial applications. Image Credit: Waters | Wyatt Technology
Hyaluronic acid has been broadly researched.1-7 Its physiochemical behavior has been directly linked to material attributes such as the weight-average molecular weight (Mw), molecular weight distribution (or polydispersity index [PDI]), intrinsic viscosity ([η]), and molecular conformation.
Previous hyaluronic acid experiments have involved several size-exclusion chromatography (SEC) studies. Standard SEC involves chromatographically separating samples, observing the output with a concentration detector like a refractometer or UV absorbance detector, and using the elution time to determine molar mass.
SEC, in this manner, is a relative measurement as the chromatographic system must initially be calibrated with various known molar mass standards to generate a calibration curve. Calibration accuracy relies on the analyte having equal conformation and column interactions as the reference specifications.
Other SEC hyaluronic acid studies have used multiangle light scattering (MALS) devices in series with concentration detectors. This is beneficial as SEC-MALS is an extremely sensitive method for calculating absolute molar masses that does not depend on calibration standards or prior assumptions regarding molecular conformation.
A sample’s root-mean-square radius Rg can also be determined with SEC-MALS if the sample Rg is more than 10 nm.
Pullulan is a universal SEC calibration standard for determining hyaluronic acid's molar mass. It is a neutral polymer with a random coil conformation in solution. The charts below demonstrate that traditional SEC with column calibration with Pullulan standards overestimates hyaluronic acid's molar mass.
Hyaluronic acid is polyanionic and grows in solution because of electrostatic repulsion. Different conformations in solution make column calibration with pullulan an inaccurate approach for establishing the Mw of hyaluronic acid. Precise Mw values of hyaluronic acid are established by MALS.

dRI chromatogram of pullulan and HA with associated Mw values determined by MALS across the peak. Image Credit: Waters | Wyatt Technology
The Mendichi group at the Istituto di Chimica delle Macromolecole (Milan, Italy) performed sophisticated studies involving SEC-MALS of hyaluronic acid coupled with online, single-capillary viscometry.2,3
This combination of detectors generates the aforementioned material characteristics and elucidates sample intrinsic viscosity and molecular confirmation using the Mark–Houwink–Sakurada (MHS) relationship.
Single-capillary viscometry is fundamentally susceptible to the sound produced by system pressure variations. Even using a pulse-free pump and Fourier-transform data filtering, a single-capillary viscometry detector S/N of only approximately 125:1 has been demonstrated.8,9
Another disadvantage of this method is its dependence on calibration using many known standards.
Differential viscometry is especially beneficial compared to single-capillary viscometry, as will be highlighted. This article discusses SEC-MALS-IV for absolute determination of hyaluronic acid properties utilizing MALS, differential refractometry, and differential viscometry detectors alongside SEC separation.
Materials and Methods
Samples
Seven diverse hyaluronic acid samples were utilized for this experiment. Sources included rooster comb, umbilical cord, and bacterial fermentation. Ovalbumin was acquired from Sigma (St. Louis, Missouri). All other chemicals were analytical grade.
Analytic Instruments
The chromatographic system comprised an HPLC system and autoinjector (Agilent 1100], 900 μL injection loop) with a solvent degasser (ERC L761). The SEC column system comprised a Polymer Labs Aquagel—OH (8 μm) separation column with a guard column.
The mobile phase was phosphate-buffered saline (PBS, 8 mM dibasic sodium phosphate, 22 mM monobasic sodium phosphate, 150 mM sodium chloride in doubly deionized water). The flow rate was 0.5 mL/min.
The series utilized chromatographic detectors such as the ViscoStar® differential viscometer, DAWN® MALS device, and Optilab® differential refractometer.
All solution concentrations were 0.1 mg/mL hyaluronic acid in PBS. The injection volume equaled 900 μL. The 0.167 mL/g dn/dc value for hyaluronic acid was taken from the text.1
The low concentration and high injected volume were chosen to prevent possible viscous-fingering of hyaluronic acid samples within the separation column. Injections were undertaken numerous times for each sample to confirm result repeatability.
The MALS detector establishes absolute molar mass without requiring reference standards, column calibration, or “fudge factors.” The differential refractometer was utilized for concentration measurements. Thermal control using a Peltier device enables thermal stability at or below room temperature, steady baselines, and exceptionally high S/N.
Differential Viscometry
The differential viscometer employs the traditional four-arm capillary bridge design (Figure 2). The bridge comprises four equal-impedance capillaries, with the lower left arm having an essentially zero-impedance delay volume.
As the mobile phase spreads through the tool, the differential pressure (ΔP) transducer in the bridge’s center reads zero. The sample divides equally when it enters the bridge.
When the sample reaches the delay volume, three capillaries contain the sample, and one contains only the mobile phase, creating a pressure imbalance within the bridge identified by ΔP.
The sample-specific viscosity (ηsp) can be directly established from the combined ΔP pressure imbalance and device inlet pressure (IP) via the following relationship, derived from the Stokes-Einstein equation:10
 |
[2] |
where η is the sample viscosity and η0 is the solvent viscosity.
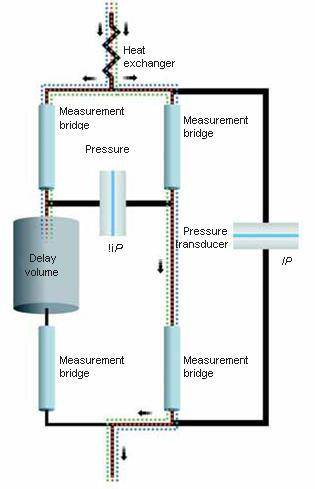
Figure 2. Schematic of the differential viscometer design. Image Credit: Waters | Wyatt Technology
This direct measurement relies only on calibrated pressure transducers. The bridge design is fundamentally unaffected by pressure fluctuations and can tolerate moderate pump pulses.
The device also uses a Peltier thermoelectric device for precision thermal control in a vast temperature range, including at or below room temperature. Combining bridge design, accurate thermal control, and modern electronics produces a device with outstanding S/N. A more sophisticated design is illustrated in “ViscoStar: Innovations in Online Viscometry for GPC.”
Data Analysis
Experimental collection and data analysis were accomplished using the ASTRA software package (Wyatt Technology). The software collected and analyzed all 18 MALS angles, the ΔP, IP, and differential refractometry signals.
Understanding ηsp, as verified by the differential viscometer and concentration c established by the differential refractometer, directly calculates intrinsic viscosity [η] using Equation 3, which is added to each data slice across an elution peak.
 |
[3] |
The MALS detector also delivers molar mass data at every data slice, and the entire distribution can be fit to the MHS equation,
where M is molecular weight and K and a are MHS coefficients corresponding to polymer shape and solvent interaction. The a value indicates polymer shape in solution, with lower a values (for example, a < 0.5) signifying more compact configurations and higher a values (for example, a > 0.8) signifying extended conformations.
The sample’s hydrodynamic volume Vh can also be established from MALS and viscometry measurements via the Einstein–Simha relation:
 |
[5] |
where NA is Avogadro’s number. The viscometric hydrodynamic radius Rh is measured as
 |
[6] |
Specified this way, Rh is the sphere radius with the same [η] as the sample.
Band-Broadening Correction
Every flow cell works like a small mixing volume as the sample passes through the detectors. These distinct mixing chambers primarily cause a sharp peak to broaden with a slight exponential tail. Left unadjusted, this produces distorted experimental results.10
Band broadening exists whenever multiple detectors are utilized for HPLC detection. The software uses a proprietary band-broadening correction algorithm, solving the long-standing issue of inter-detector band broadening.
Results and Discussion
Table 1 summarizes the material attributes established for the seven hyaluronic acid samples. Results correspond to published values.1-3,5
Figure 3 details a standard ηsp chromatogram of a hyaluronic acid sample and the related Mw, Rg, and Rh values across the peak. The normal differential viscometer S/N of the ηsp trace for these hyaluronic acid experiments equaled 2200:1, more than one order of magnitude superior to pulse-free, data-filtered single-capillary viscometry.

Figure 3. ηsp chromatogram of sample HA-2 with associated Mw, Rg, and Rh values across the peak. Image Credit: Waters | Wyatt Technology
MHS plots were generated for all samples to calculate molecular conformation data. See Figure 4 for a representative MHS plot of sample HA-2. The least-squares regression of the MHS trace can also be observed in Figure 4.
The HA-2 sample’s K and a values were calculated from this regression as K = 0.0277 and a = 0.817, close to published values. These figures should not be taken at face value, as the MHS trace shows marked curvature.
Though not detailed, all seven hyaluronic acid samples evaluated throughout this experiment demonstrated MHS curvature similar to that seen in Figure 3.
As all hyaluronic acid MHS plots illustrate curvature, the K and a coefficients established by direct linear regression of MHS plots do not accurately determine MHS behavior across the entire span of hyaluronic acid molecular weights. This is valid for previously published K and a values.
By employing a polynomial fit (in this case, second order) of the MHS curve and then taking that function’s derivative, the instantaneous a value (ai) can be established:
| ai = d(log[η])/d(logM). |
[7] |
Table 1. Summary of HA sample material characteristics. Source: Waters | Wyatt Technology
| HA Sample |
HA Source |
Mw (g/mol) |
PDI |
Rg (nm) |
[η] (mL/g) |
rh (nm) |
| HA-1 |
Bacterial fermentation |
2.64E+05 |
1.19 |
57.7 |
632 |
27.7 |
| HA-2 |
Umbilical cord |
2.84E+05 |
1.23 |
66.1 |
652 |
28.3 |
| HA-3 |
Chicken comb |
6.62E+05 |
1.10 |
109.1 |
1431 |
51.1 |
| HA-4 |
Bacterial fermentation |
1.10E+06 |
1.45 |
165.4 |
1754 |
57.7 |
| HA-5 |
Umbilical cord |
1.44E+06 |
1.06 |
180.4 |
2208 |
77.7 |
| HA-6 |
Chicken comb |
1.62E+06 |
1.06 |
182.4 |
2671 |
86.1 |
| HA-7 |
“Natural sources” |
1.76E+06 |
1.02 |
207.9 |
2655 |
89.9 |

Figure 4. Mark–Houwink–Sakurada plot and linear fit for sample HA-2. Image Credit: Waters | Wyatt Technology
Figure 5 shows the ai values of sample HA-2, ranging from 1.0 at lower molecular weights to almost 0.55 at high molecular weights. The six other hyaluronic acid samples exhibited ai behavior comparable to that detailed earlier, with standard ai values that range from 1.1 at low molecular weights to 0.5 at high molecular weights.
This fluctuation in a across its molar mass range suggests that hyaluronic acid exhibits free-draining, non-Gaussian chain behavior at lower molecular weights.2 The inherent rigidity of this polyelectrolyte causes the molecule to adopt a more elongated conformation at reduced molecular weights and a similarly high ai value.
As molecular weight grows, hyaluronic acid slowly adopts normal Gaussian chain behavior, and ai values decline. This could help support the extensive range (and contradiction) of hyaluronic acid MHS constants published in the sources.

Figure 5. Mark–Houwink–Sakurada plot, second-order fit, and ai versus log(Mw) for sample. Image Credit: Waters | Wyatt Technology
Conclusions
By joining a MALS device, a differential refractometer, and a differential viscometer with SEC, the material properties of the biopolymer hyaluronic acid have been explored.
The absolute hyaluronic acid molecular weight, molecular weight distribution, and radii information have been established to coincide with historical source values.
As the Mendichi group previously revealed, hyaluronic acid molecular conformation exhibited strange behavior, as interpreted via MHS analysis.
Using these detectors alongside the software guaranteed swift, precise, absolute analysis of this behavior with unparalleled S/N and no requirement for calibration curves for any detector.
References
- Hokputsa, S., et al., 2003. European Biophysics Journal, 32, pp. 450–496.
- Mendichi, R., Šoltés, L. and Giacometti Schieroni, A. (2003). Evaluation of Radius of Gyration and Intrinsic Viscosity Molar Mass Dependence and Stiffness of Hyaluronan. Biomacromolecules, 4(6), pp.1805–1810. https://doi.org/10.1021/bm0342178.
- Mendichi, R. and Giacometti Schieroni, A. (2002). Fractionation and characterization of ultra-high molar mass hyaluronan: 2. On-line size exclusion chromatography methods. Polymer, 43(23), pp.6115–6121. https://doi.org/10.1016/s0032-3861(02)00586-4.
- Mendichi, R., et al. (1998). Characterization of ultra-high molar mass hyaluronan: 1. Off-line static methods. Polymer, 39(25), pp.6611–6620. https://doi.org/10.1016/s0032-3861(98)00167-0.
- Soltes, L., et al. (2002). Molecular characteristics of some commercial high-molecular-weight hyaluronans. Biomedical Chromatography, 16(7), pp.459–462. https://doi.org/10.1002/bmc.185.
- Kakehi, K., Kinoshita, M. and Yasueda, S. (2003). Hyaluronic acid: separation and biological implications. Journal of Chromatography B, 797(1-2), pp.347–355. https://doi.org/10.1016/s1570-0232(03)00479-3.
- Berriaud, N., Milas, M. and Rinaudo, M. (1994). Rheological study on mixtures of different molecular weight hyaluronates. International Journal of Biological Macromolecules, 16(3), pp.137–142. https://doi.org/10.1016/0141-8130(94)90040-x.
- R. Mendichi and A. Giacometti Schieroni (1998). Evaluation of a single-capillary viscometer detector on line to a SEC system used with a new pulse-free pump. Journal of Applied Polymer Science, 68(10), pp.1651–1659. https://onlinelibrary.wiley.com/doi/10.1002/%28SICI%291097-4628%2819980606%2968%3A10%3C1651%3A%3AAID-APP14%3E3.0.CO%3B2-%23-.

This information has been sourced, reviewed and adapted from materials provided by Waters | Wyatt Technology.
For more information on this source, please visit Waters | Wyatt Technology.