Bubbles which are smaller than 1 µm are described as being ‘ultrafine’. This type of bubble has certain features which ordinary bubbles do not, namely that they lower the surface tension of a liquid and stay within it longer.
For a long time, these traits have been exploited. However, the technology continues to expand into new applications in a variety of fields, such as cosmetics, detergency, semi-conductors, medicine, and enabling the acceleration of vegetables growing in agriculture.
The difficulty comes when trying to detect and characterize these extremely fine bubbles in order to highlight their efficiency. This is where Static Multiple Light Scattering is useful. This works by monitoring the stability of ultrafine bubbles in water, and also determining their size and concentration.
Reminder on the Technique
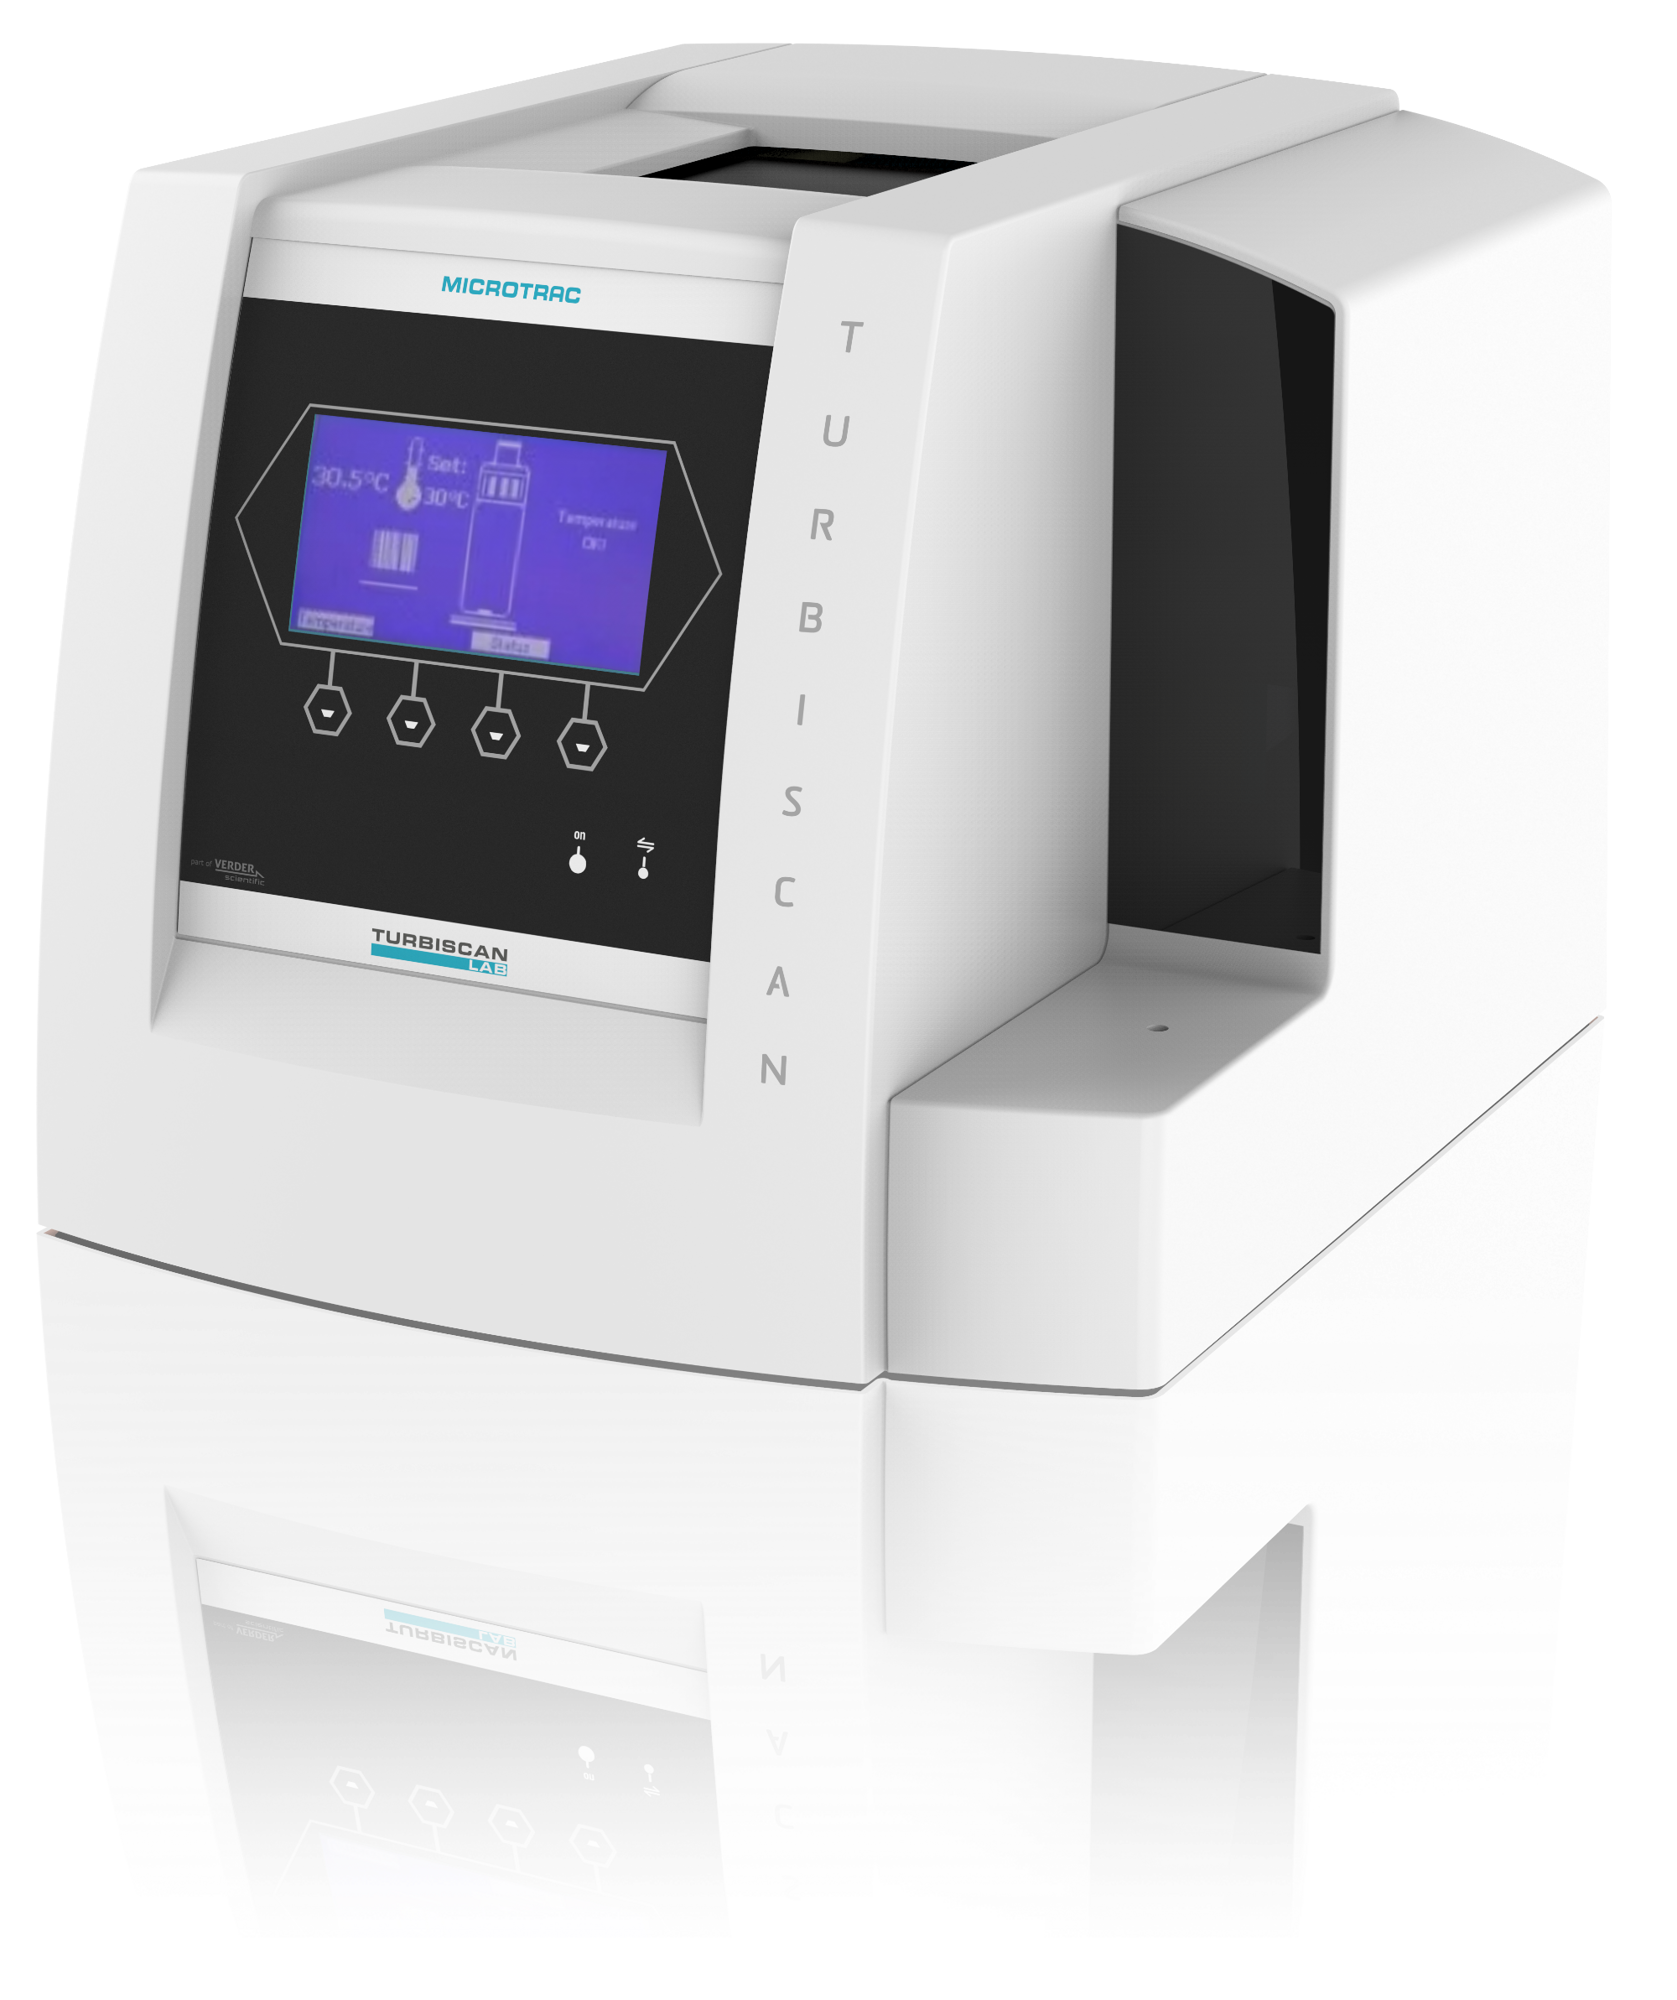
Based on Static Multiple Light Scattering, Turbiscan technology consists of a light source at around 880 nm being sent onto a sample. Backscattered (BS) and transmitted (T) signal is then acquired across the entire of the sample’s height.

By adapting the frequency and repeating this measurement over a period of time, the monitoring of physical stability is enabled by the instrument.
According to the Mie theory, this technology also facilitates the direct measurement of the mean spherical equivalent diameter (d), with the signal intensity and knowing refractive index of continuous (nf) and dispersed phases (np) and the particle concentration (φ): BS=f(d, φ, np, nf) (BS represents ‘Backscattering Intensity’ and T represents ‘Transmission Intensity’).
With knowledge of refractive indexes and diameter, the volume fraction can be computed in return.
Method
Samples of ultrapure water were analyzed and compared against samples charged with ultrafine air bubbles at two different concentrations (High HC and low LC).
Ultrafine Bubbles Signal Sensitivity
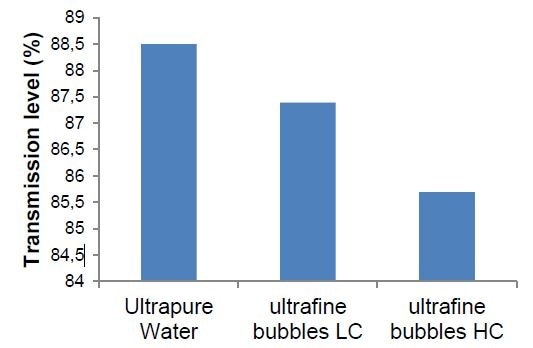
As the samples analyzed were transparent, only the transmission signal is to be considered. Figure 1 displays the transmission levels for both ultrapure water and water charged with ultrafine bubbles. As the signal reproducibility of Turbiscan is 0.1%, any variation exceeding 0.1% is considered significant.

Figure 1. Transmission level (%) for ultrapure water and water with ultrafine bubbles at low (LC) and high concentration (HC).
At different concentrations, the transmission signal measured with Turbiscan is sensitive to differentiate ultrafine bubbles. The higher the concentration of air bubbles, the lower the transmission intensity.
Ultrafine Bubbles Stability
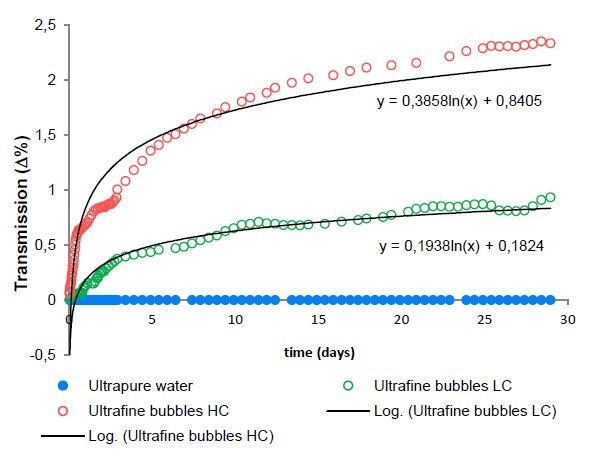
The samples were monitored for 30 days and kept at 25 °C. This was in order to study the stability of ultrafine bubbles in water. The transmission evolution of these studied samples over time is displayed in Figure 2.

Figure 2. Stability versus time for samples at 25 °C during 1 month.
For water, the transmission signal remains constant. For samples of ultrafine bubbles, however, the signal increases over time. This shows that the concentration of bubbles evolves and, more specifically, decreases over time.
It is possible to determine the time required to attain the transmission level corresponding to ultrapure water by extrapolating the curves. This time corresponds to the stability time of ultrafine bubbles.
The higher the concentration of ultrafine bubbles is initially, the longer it takes to reach the level of water.
The higher the initial concentration of ultrafine bubbles, the longer it takes to reach water level.
| Sample |
Time to reach ultrapure water level (extrapolation) |
| Low Concentration (LC) |
68 days |
| High Concentration (HC) |
96 days |
Ultrafine Bubbles Size and Concentration Measurement
Size Measurement:
Using an IDEC device, the size of ultrafine bubbles was measured on the High Concentration sample (HC) with a known concentration of bubbles.
| Sample |
Refractive index bubbles |
Refractive index water |
Number concentration (bubbles/mL) |
Diameter(nm) |
| HC |
1 |
1.33 |
1011 |
100 |
(non underlined = known, underlined = measured)
Concentration Measurement:
Knowing the initial size of the bubbles, the concentration of ultrafine bubbles in the Low Concentration sample (LC) was determined.
| Sample |
Refractive index bubbles |
Refractive index water |
Diameter (nm) |
Number concentration (bubbles/mL) |
| LC |
1 |
1.33 |
100 |
1010 |
(non underlined = known, underlined = measured)
Conclusion
Turbiscan technology can monitor the stability of ultrafine bubbles compared to ultrapure water. The transmission signal is sensitive enough to detect the presence of ultrafine bubbles in water, and allows for the monitoring of the evolution of the concentration of ultrafine bubbles over time in the same sample.
This technology is also able to measure the size and concentration of bubbles without the preparation or dilution of samples.

This information has been sourced, reviewed and adapted from materials provided by Microtrac MRB.
For more information on this source, please visit Microtrac MRB.