In the field of physical optics, a propagating light beam is referred to as a propagating electromagnetic radiation, with the direction of propagation being horizontal to the direction of the magnetic and electric field vector.
The polarizing direction of light is described as the direction of the electrical vector component. If the route of the electrical field is consistent during this propagation, the light will be polarized in a direct manner.
This shows that the perpendicular components of this electric field vector are in phase, or there is no phase variation between them (see Figure A). If a 90 degree phase difference occurs between the perpendicular components, then the light is circularly polarized (see Figure B). Frequently, light is polarized elliptically (see Figure C), where the two components have a minimal variation in phase.
Figures A, B, and C demonstrating light polarization.*
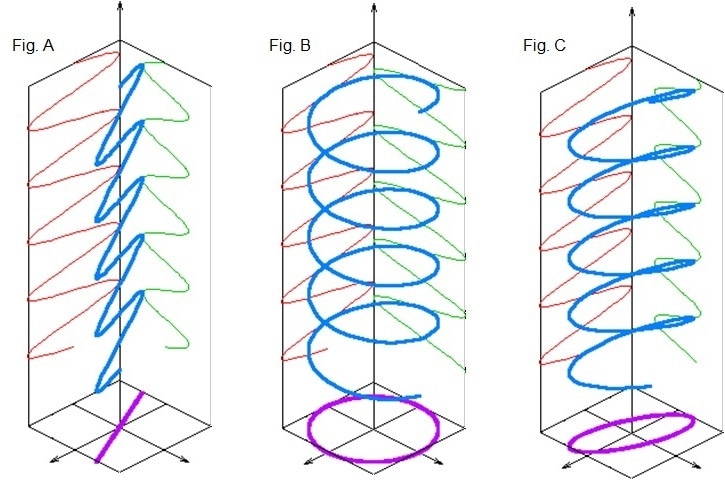
Figs. A, B & C: light polarization. Image Source: Wikipedia
Measured Quantities
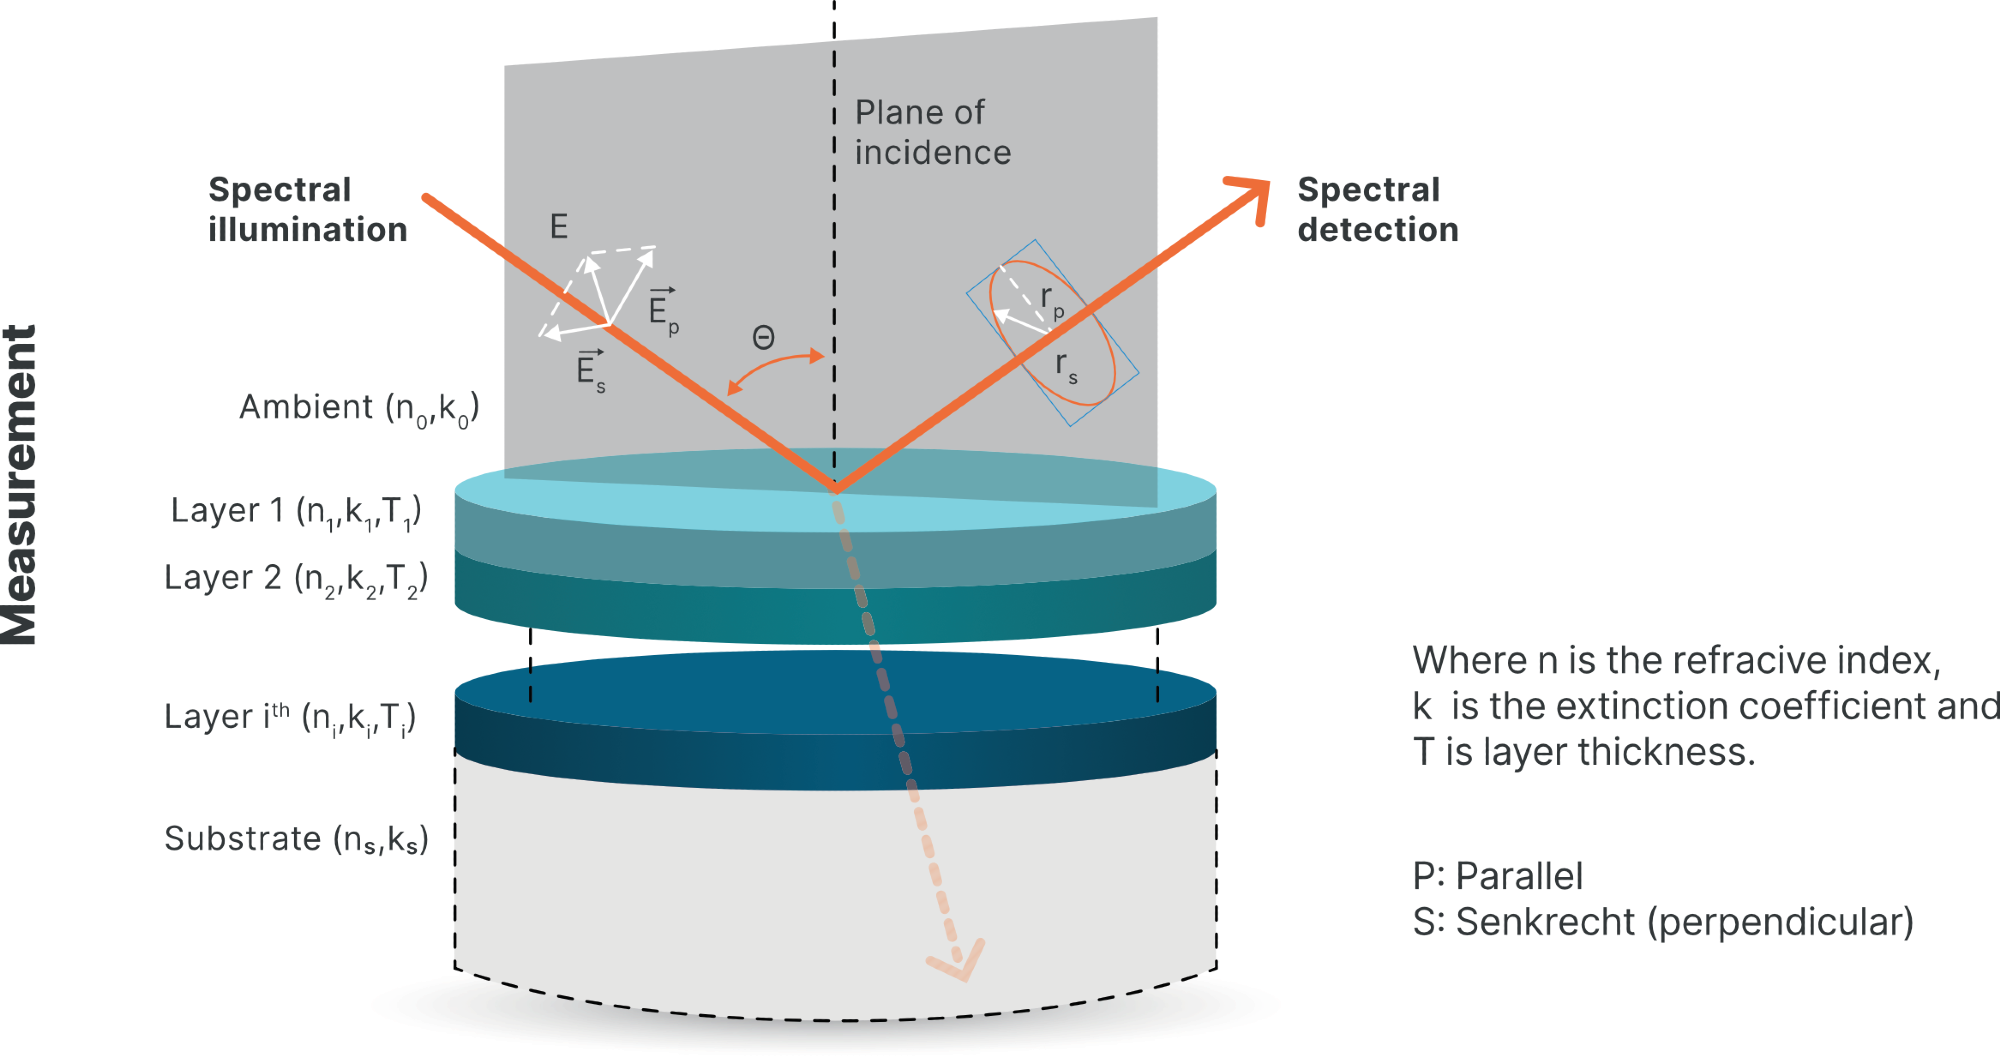
As an optical method, ellipsometry requires no contact and is not harmful. It analyzes the thickness and optical purposes of each layer in a multilayer structure. Ellipsometry is highly sensitive as it is established when analyzing the phase shift of a light beam transporting through a structure of layers. Also, phase angle analysis is not dependent on the absolute intensity of light.
Spectral data can be collected from the sample by utilizing sources of white light and monochromators. The measurements taken from each parameter holds the physical properties of the layer structure, for example the thickness of layers and the refractive index, but in a particularly unpredictable manner. Measure the ratio of the complex Fresnel reflection coefficients. As this number is complex, it can be divided into an amplitude term and a phase shift term, which both relate to the purported ellipsometric angles, Ψ and Δ.
Fundamental Equation of Ellipsometry
Precisely measured parameters outline the elliptical polarized reflected light:
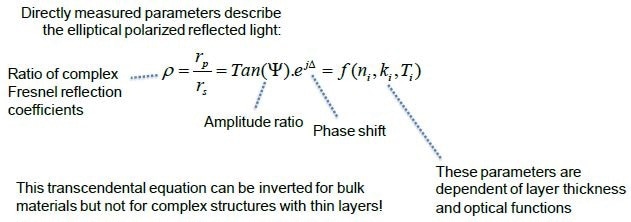
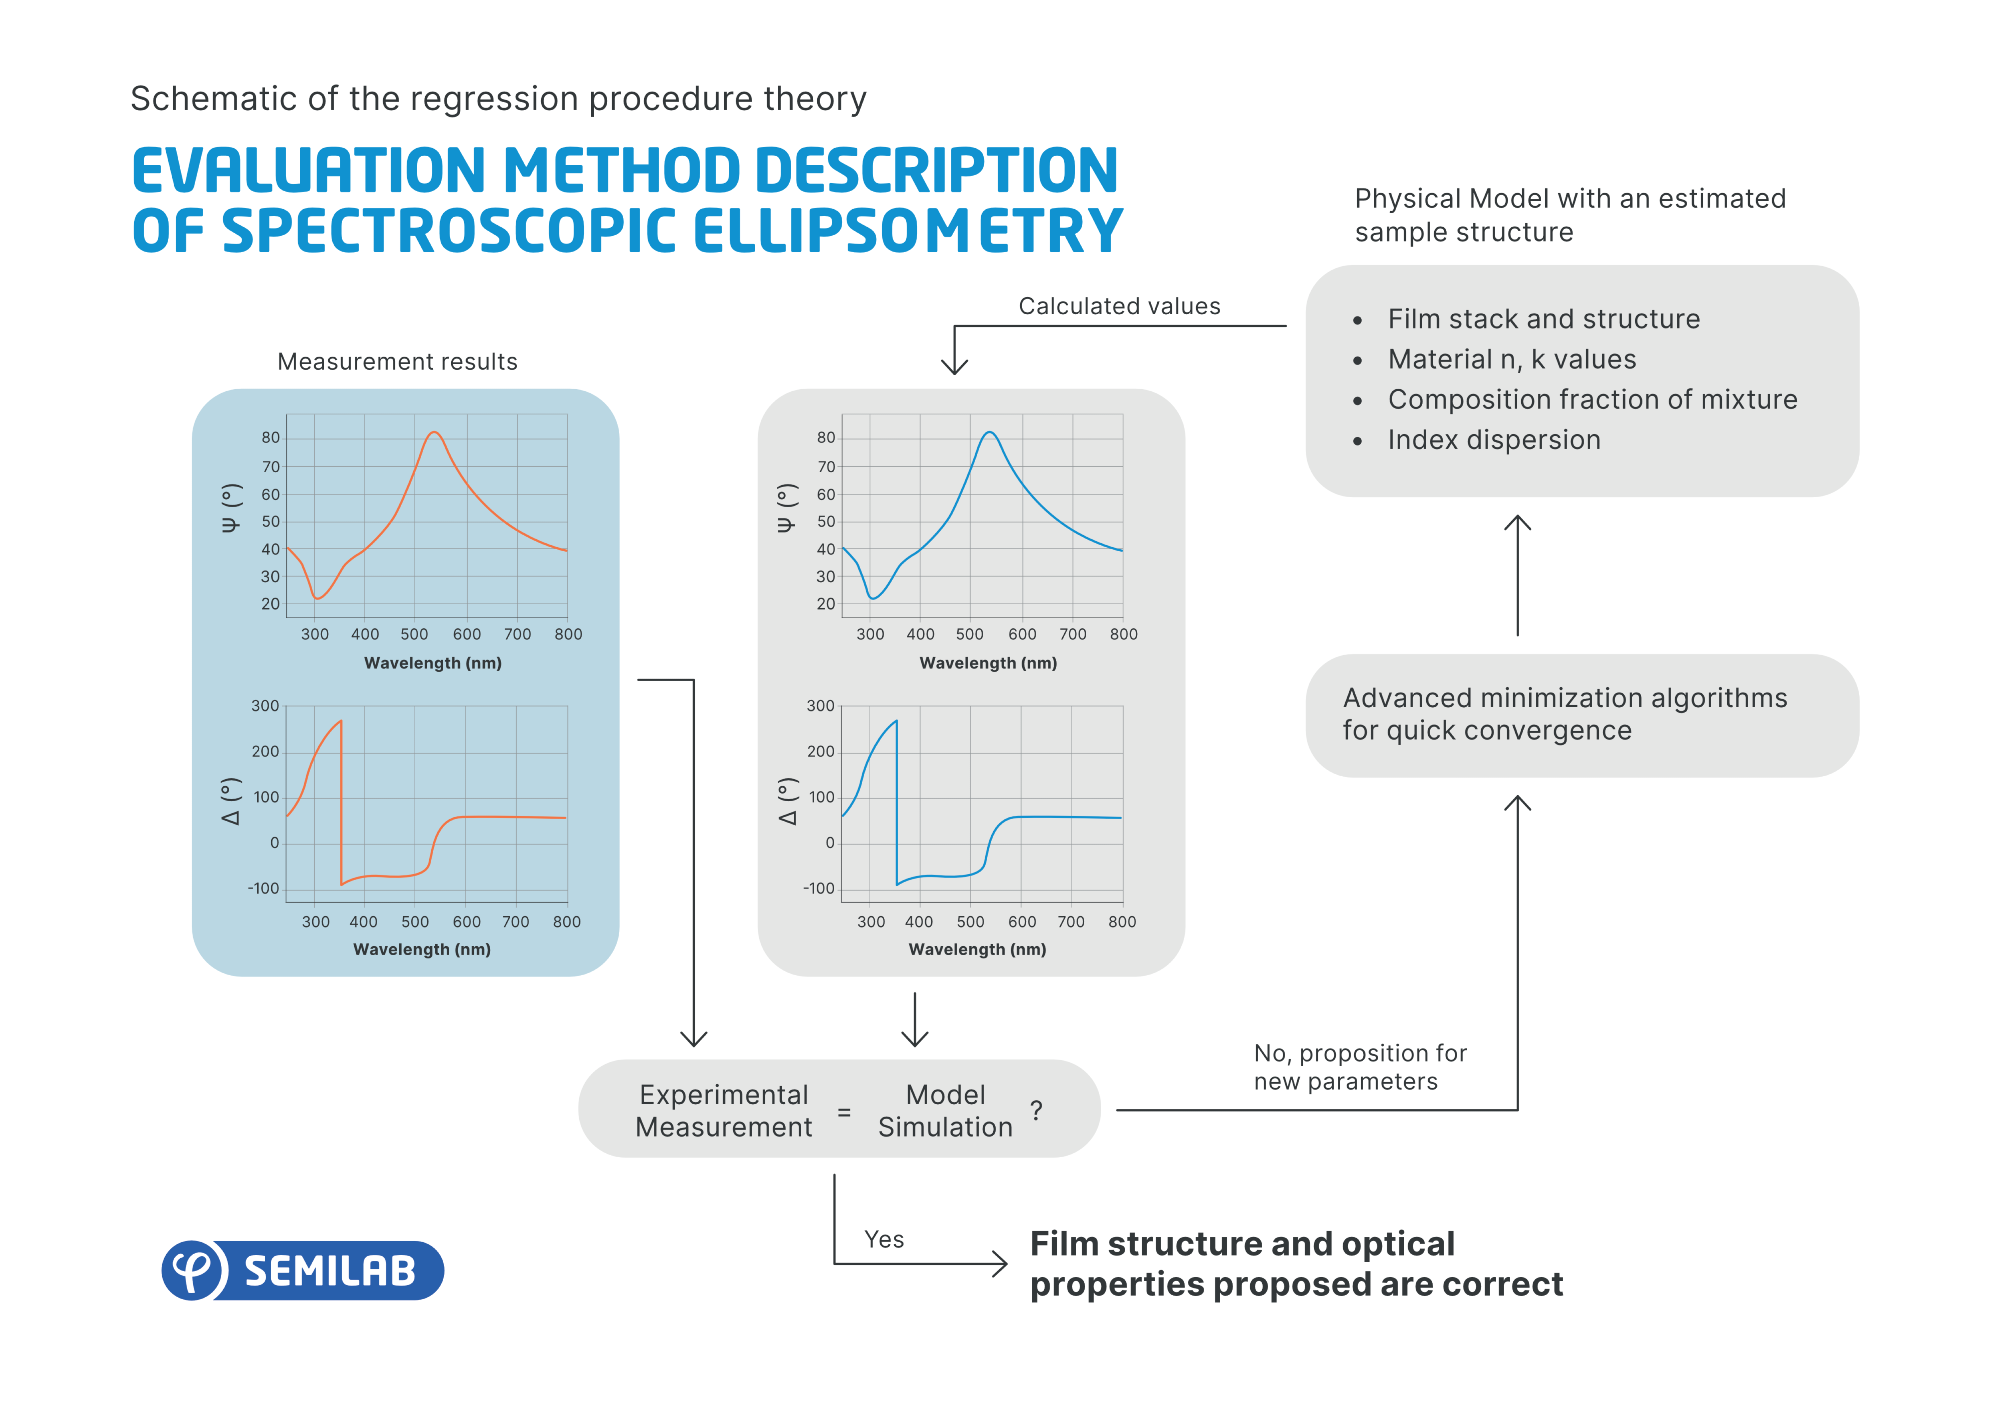
A model-based indirect numerical calculation can allow for the analysis of complex structures involving more than one layer and their properties.
- The layer structure is taken into account, along with thickness and optical functions serving as parameters
- The relative phase shift is calculated and compared against measured parameters, which is the numerical regression procedure detailed below.
Numerical Regression Procedure Based on an Optical Model
Advanced Formalism
The state of polarization for a wholly polarized light beam can be loosely outlined by utilizing the Jones vectors, such as Ex, Ey components:

A variation of the Jones vector once reflection from a sample structure has taken place, can be illustrated by the 2x2 element known as the Jones Matrix. For example, a shift from a linearly polarized state to an orthogonal state can be characterized as:

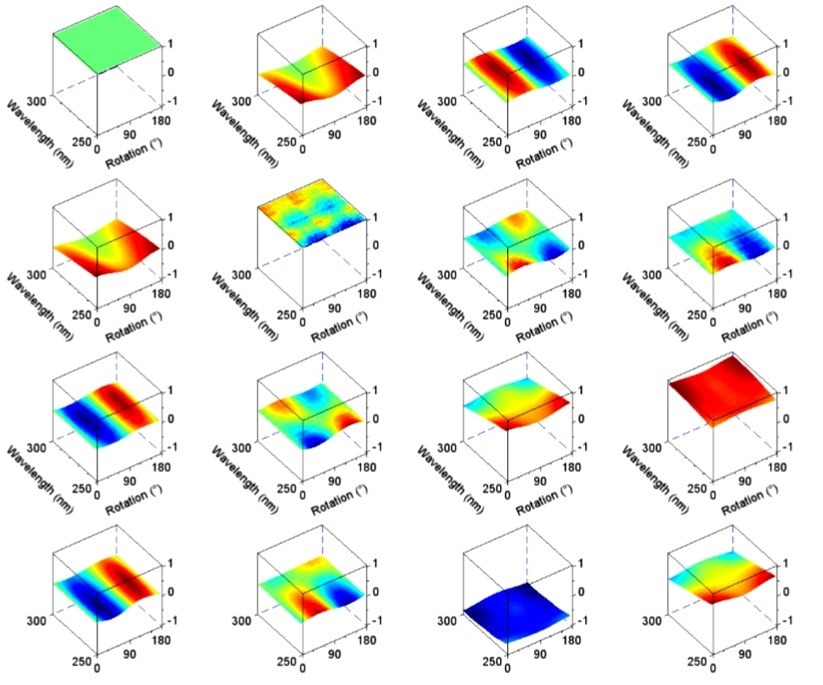
Example: Mueller Matrix of an optically active sample measured vs. stage azimuth rotation. Revealing rotational symmetry of molecular composition.* (*Example measurement: Monomolecular organic coating on solid substrate—Semilab measurement in cooperation with EPFL)
Moderately polarized light beams can be outlined by the more commonplace Mueller Matrix formalism founded on the 4D Stokes vectors:
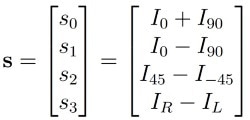
In this example, S0 is the light intensity as a whole. S1 is the variation of intensity between the vertical and horizontal polarization. S2 is the variation of intensity between linearly polarized components in +45 ° and –45 ° directions. S3 is the variation of intensity between left and right oriented circularly polarized components.
The method of multiplying the inbound light’s Stokes vector by the material’s Mueller Matrix leads to the Stokes vector describing the reflected light:

In the process of measuring the Stokes vector of the inbound and reflected light, the Mueller Matrix of the material can then be analyzed. This allows for the analysis of material properties by utilizing the Mueller Matrix elements.
The optical symmetries of the material are reflected by the symmetry of the Matrix, which can be done without the need for complex optical modeling of the measurement information. It is therefore frequently used as a qualitative means of analyzing an optically active sample.
Instrumentation
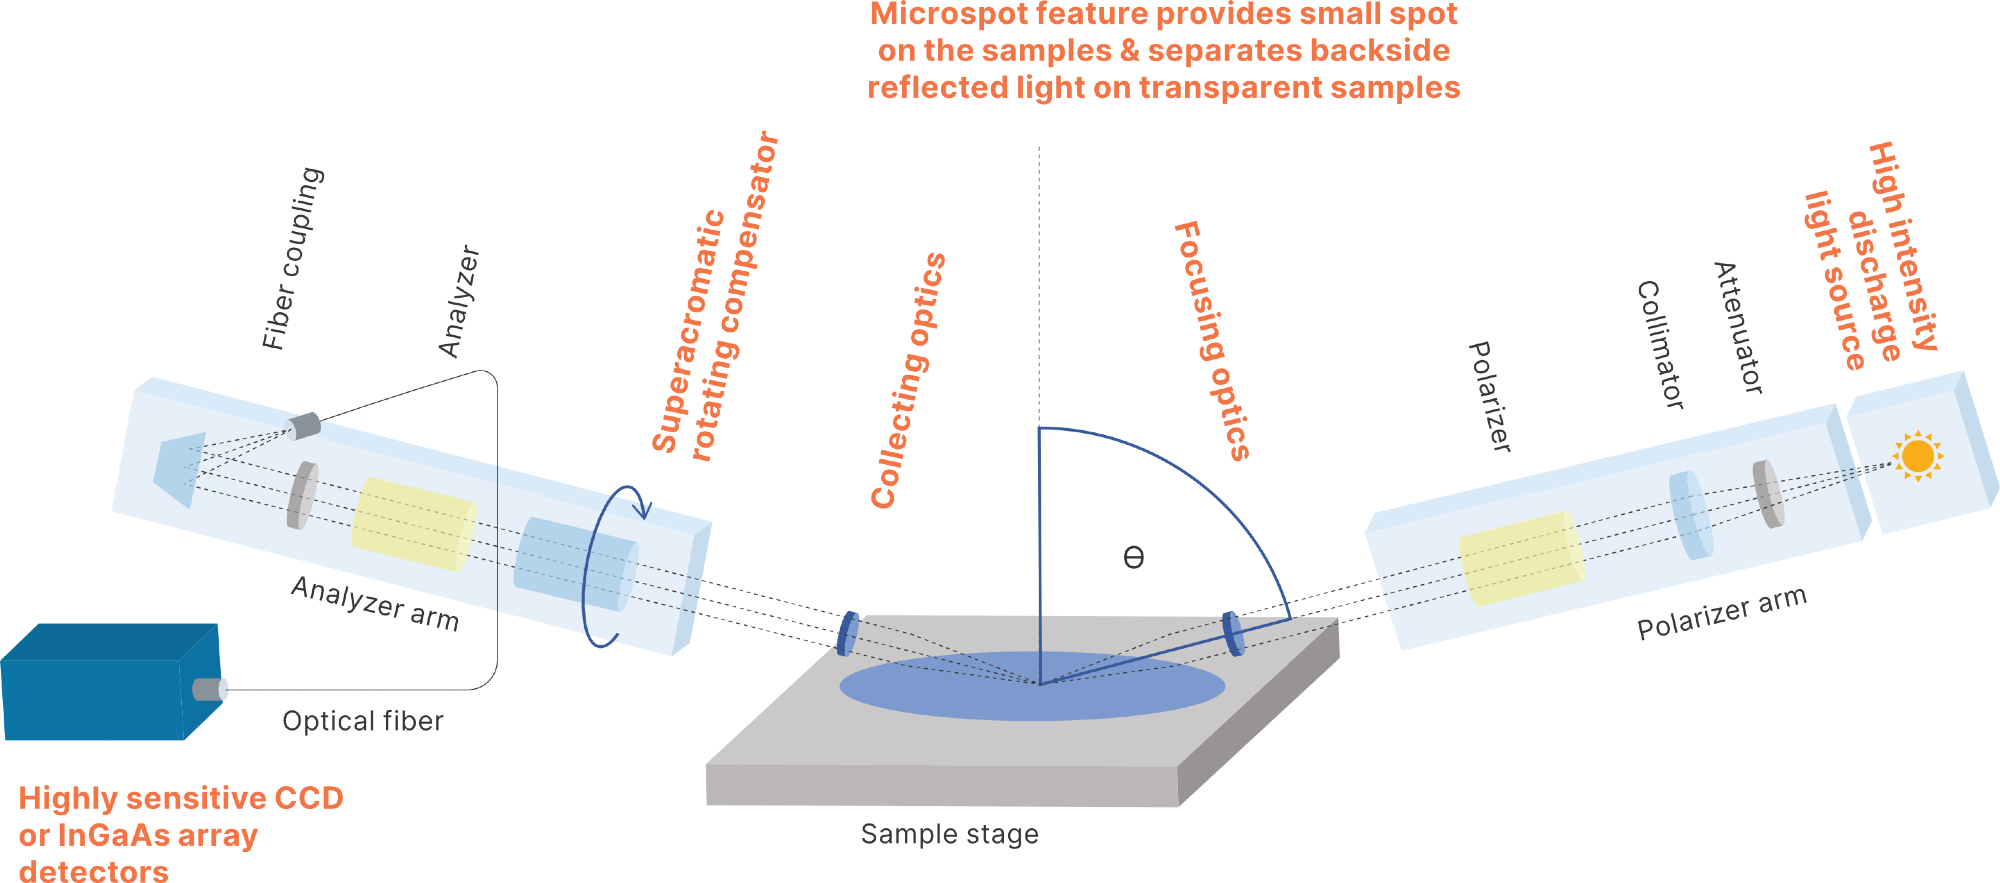

This information has been sourced, reviewed and adapted from materials provided by Semilab Semiconductor Physics Laboratory.
For more information on this source, please visit Semilab Semiconductor Physics Laboratory.