Suspended nanowires are highly favored force sensors. They are built with a very large aspect ratio (up to 5000) with a diameter and length of around 150 nm/100 μm, respectively, and effective masses that fall in the picogram range.
Suspended nanowires identically oscillate along the two transverse directions, which enables users to operate them as vectorial 2D force sensors having sensitivities in the range of attonewton/√Hz at room temperature [1].
This article covers how these characteristics, along with the HF2LI phase-locked loop (PLL), can be utilized to attain 2D force measurements based on the optical readout of SiC-nanowires’ vibration.
2D - Force Field Sensing
Nanowire Mechanics
When the force field is applied at the edge of a singly clamped suspended nanowire, its dynamics can be assimilated to one of its two central, transverse eigenmodes. The deflection δr of the nanowire edge is expressed as follows:
 |
(1) |
with the eigenmode frequencies ?1,2/2π, the intrinsic damping rate Γ, and the effective mass Meff of the oscillator. Without any external force, the driving force F is a stochastic Langevin force vector δFth(t) at the origin of the Brownian motion of the oscillator as illustrated in Figure 1.

Figure 1. The scheme illustrates the vibration pattern of the two first fundamental mechanical-modes of a suspended nanowire. Due to a slight geometrical asymmetry, the nanowire presents two perpendicular modes (labeled 1 and 2) with around 1% relative frequency splitting. The right part shows typical Brownian motion trajectories in 2D of the nanowire tip (2 s acquisition).
The nanowire undergoes an extra external force Fext (r0 + δr), which is assessed at the position of the nanowire extremity r0 + δr, when immersed in the local force field under examination. In a first-order approximation, it can be expanded as
 |
(2) |
In this case, the first term describes a static local force while the second is the gradient that the nanowire experiences along its oscillations. The former results in a static deflection of the nanowire’s rest position (equal to a few nm), while the latter adds to the restoring forces and therefore, changes the mechanical properties of the nanowire. With this linearization, Equation 1 can be expressed in Fourier space by
 |
(3) |
where an external driving force has been integrated, with the dressed mechanical susceptibility matrix χ which reads in the base of the bare eigenmodes:
 |
(4) |
The four components of the local 2D reduced force field gradients matrix: gij given by 1/Meff · ∂iFj were introduced and are relative to the derivative along the direction i of the force projected along the direction j. This dressing does not alter the Langevin force vector δFth. It is possible to examine the force field by its effect on the nanowire thermal noise in 2D, as was initially done in the group to establish the force field gradients. [2] This measurement can also be attained with an external driving force that will act to accomplish driven response measurements to establish the dressed mechanical susceptibility of the nanowire. To achieve that, the dual PLL scheme, illustrated in this article, will be used.
Diagonalizing the matrix in Equation 4 presents two dressed eigenmodes of the perturbed system. The 2D force field gradients can create eigenmode frequency shifts and rotations of the eigenvectors. It has been revealed [2] that the measurement of those four quantities allows a full determination of the local force field gradient matrix (gij).
Hence, to detect alteration of the two eigenmode orientations, it is essential to use a 2D readout of the nanowire motion.
Optical Readout Along Two Dimensions
Owing to their high refractive index, which causes the occurrence of internal Mie resonances, the SiC nanowires contain a large optical scattering cross-section. This enables efficient optical position readout even though their diameter is very small when compared to the wavelength of visible light. Located in the waist of a focused laser beam, the light reflected off the nanowire can be captured through the focusing objective. It is also recorded on a split photodiode delivering the sum and difference signals calculated from the amplitudes measured on the two segments of the photodiode.
In Figure 2, this readout method is illustrated and the two maps obtained on each measurement channels are displayed when scanning the nanowire in the waist area: δV?,⊕(r0). When the nanowire pulsates, it dynamically controls the photocurrents as: δV?,⊕(t) = δr(t) · ∇V?,⊕, so that each photodiode output carries out a projective measurement of the nanowire motion along a measurement vector demarcated by the local gradients of the reflected maps. Placing the nanowire at a position marginally offset from the waist on the optical axis enables the operation of two quasi-perpendicular measurement channels.
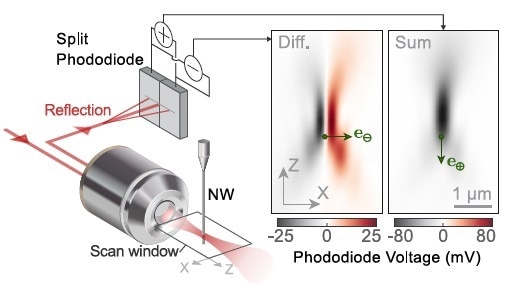
Figure 2. Optical readout scheme of the nanowire position in the xz plane. The intensity maps (right) display the reflection signals measured during a scan of the nanowire in the xz-plane. Their local gradients determine the readout vectors. The highlighted position provides two quasi-perpendicular measurement vectors.
After the working point is fixed, the LabOne Spectrum Analyzer module is used to compute the spectra of the sum and difference signals to record and define the nanowire noise spectra. Figure 3 illustrates a nanowire’s thermal noise spectrum with the eigenmodes sloping 45° towards the readout vector so that each mechanical polarization is efficiently read on each measurement channel. The two diverse eigenmode frequencies are 27.80 kHz and 27.94 kHz.
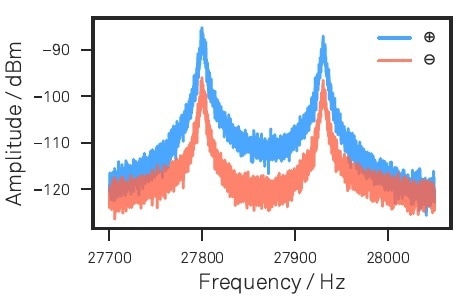
Figure 3. Nanowire thermal noise spectra for eigenmode calibration as measured along the ⊕ and ? readout channels. The spectrum has been acquired using the LabOne API.
Dual Resonance Tracking
Experimental Realization
For the experiment, a dual resonance tracking method was executed, which uses two autonomous PLLs. In contrast to a thermal noise-based force gradient measurement [2], this measurement method based on regulated driven trajectories (and not on arbitrary thermal noise trajectories) does not need the fitting of spectra. Moreover, the measurements can be very fast and the speed is only restricted by the finite linewidth of the mechanical resonances, which relates to the time taken by the nanowire to adapt to the variation in the external force landscape.
Figure 4 shows the experimental setup. A vacuum chamber decreases the frictional damping of the nanowire and sequesters the setup from environmental unrests. An XYZ piezo stage regulates the position of the experiment’s sample and nanowire relative to the fixed laser beam. A second XYZ Piezo stage regulates the position of the sample in relation to the nanowire. The optical force of an amplitude modulated green laser, co-injected with the red probe beam, works to drive the nanowire, taking on the role of the test driving force δFdrive in Equation 3, with an efficiency of approximately 1 fN/μW.
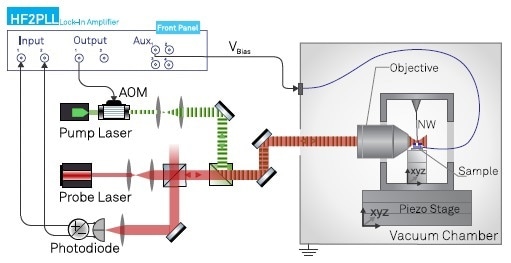
Figure 4. Experimental setup illustrating the 2D optical readout channels (red probe laser beam), the intensity modulated optical drive (green pump laser), the voltage bias and their connections to the HF2LI instrument.
This green laser beam is capable of managing both nanowire transverse modes as they are primarily not aligned with the optical axis. The split photodiode is used to record the driven trajectories, which are used to sense eigenmode rotations and mechanical frequency changes. To achieve that, the sum and difference signals are directed to the HF2PLL signal inputs. One signal output controls the intensity of the pump laser via an acousto-optical modulator (AOM). Thus, the AOM control signal is amplitude-modulated at the same time at both mechanical frequencies. To exploit the driven signals along both measurement vectors, the nanowire is rotated until its bare eigenmodes form an angle of around 45° in relation to the optical axis. This also guarantees that the pump laser can drive the two modes capably.
The measured response in the described configuration is illustrated in Figure 5. This response curve gives the set-point parameters for the PLL. They can simply be read in the LabOne Sweeper module. While being measured, four of the six available demodulators examine the two input signals at both resonance frequencies. Therefore, all quantities essential to reconstruct eigenmode orientations and eigenfrequency changes are concurrently measured.
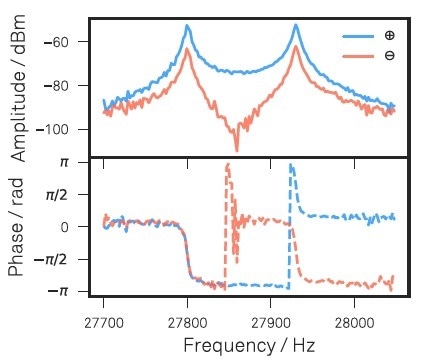
Figure 5. Amplitude and phase of sum and difference signals measured with the LabOne Sweeper in response to the optical drive. These response measurements serve to set the dual PLL parameters that will subsequently track both mechanical resonances.
Force Gradient Imaging
The imaging capabilities of the setup are demonstrated using a test sample that produces an electrostatic force field with known features. The sample comprises a structured conducting surface on which a bias voltage can be applied.
When the imaging is performed, the sample is scanned under the extremity of the nanowire while recording the frequency changes and amplitude variations, which are the result of eigenmode rotations. A TTL signal on the HF2LI’s DIO connector coordinates the acquisition with the Piezo stage movement. The Data Acquisition Module of the LabOne Application Programming Interface (API) suitably coordinates spatial scans and acquisition tasks by transmitting the results to a measurement interface written in Python for this experiment. The direct integration of the measurement into the current sample positioning setup facilitates direct imaging of the local force field gradient without requiring elaborate post-processing. The force field gradients are, thus, computed in quasi real-time (approximately 10 measurements per second), which enables extensive exploration of the sample under study.
One of these features is the 2D force divergence ∇ · F = Meff(g11 + g22) which is illustrated in Figure 6 for the electrostatic force above an array of holes. The observed repulsive force field of circular shape can be comprehended by the fact that the nanowire is drawn towards the border of the holes. By recording and mapping all four force field gradients above the sample under study, the 2D force field can be rebuilt with a 2D spatial integration (refer [2]).
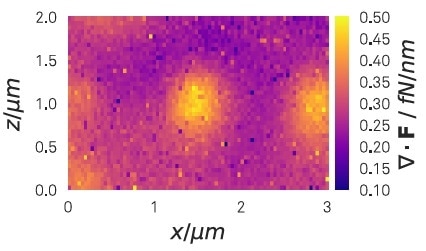
Figure 6. Measured force field planar divergence about 500 nm above an array of approx. 400 nm large holes drilled in a conducting surface. The bright central feature is located above a hole in the center of the scanned area. A bias of -0.2 V has been applied between surface and nanowire. Due to the attraction towards the periphery of the holes, the measured projected force field is repulsive from the center of the hole (positive planar divergence).
Outlook
Integrating the dual PLL of the HF2LI has boosted the measurement speed by nearly 50 times compared to earlier measurements [2] based on thermal noise examination in 2D. Furthermore, the direct monitoring of the resonance frequencies and projected driven oscillation amplitudes on each channel allows force fields to be imaged in quasi real-time without requiring laborious post-processing.
Subsequently, a bidirectional drive will be implemented using both HF2LI signal outputs so as to improve experimental control and allow signal post-processing. Making the most of these advantages along with the intrinsic sensitivity and adaptability of nanowires, measurements based on the defined method paves the path towards original explorations in physics based on ultrasensitive nano-mechanical vectorial force field sensors. A few examples are - sensing weak magnetic structures such as Skyrmions, imaging the Casimir force in non-standard geometries, or examining the coupled dynamics of a nanowire and a single spin.
References
[1] A. Gloppe, P. Verlot, E. Dupont-Ferrier, A. Siria, P. Poncharal, G. Bachelier, P. Vincent, and O. Arcizet. Bidimensional nano-optomechanics and topological backaction in a non-conservative radiation force field. Nature Nanotechnology, 9(11):920–926, Nov 2014.
[2] Laure Mercier de Lépinay, Benjamin Pigeau, Benjamin Besga, Pascal Vincent, Philippe Poncharal, and Olivier Arcizet. A universal and ultrasensitive vectorial nanomechanical sensor for imaging 2D force fields. Nature Nanotechnology, 12(2):156–162, 2016.

This information has been sourced, reviewed and adapted from materials provided by Zurich Instruments.
For more information on this source, please visit Zurich Instruments.