One of the most popular techniques for material identification is single bounce ATR spectroscopy. However, in some cases, the specular reflectance sampling technique may still be necessary. Much like light hitting a mirror, in a specular reflectance measurement, the infrared light from the spectrometer is reflected directly off the sample.
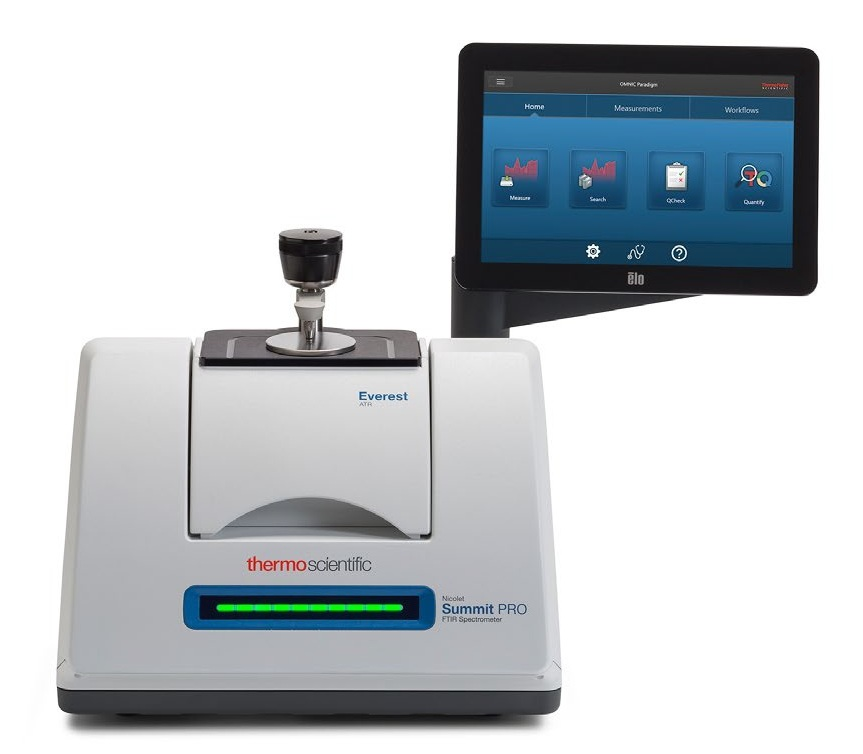
As it is a useful sampling technique, several ATR accessories can be configured to amass specular reflectance spectra. The Thermo Scientific™ Nicolet™ Summit FTIR Spectrometer with the Everest ATR Accessory is shown in Figure 1. It is possible to configure this with the specular reflection attachment.

Figure 1. Thermo Scientific Nicolet Summit FTIR Spectrometer with the Everest ATR accessory configured for Specular Reflectance
Very large samples can be measured, for example, paintings, with no contact between the instrument and the artwork using other dedicated reflectance accessories. The distorted spectra that may result from anomalous dispersion, or the possible scattering effect as the light interacts with the sample, are both disadvantages of the specular reflectance sampling technique. It is difficult to get reasonable matches with most spectral libraries when there are distorted spectra, as these are usually collected in transmission.
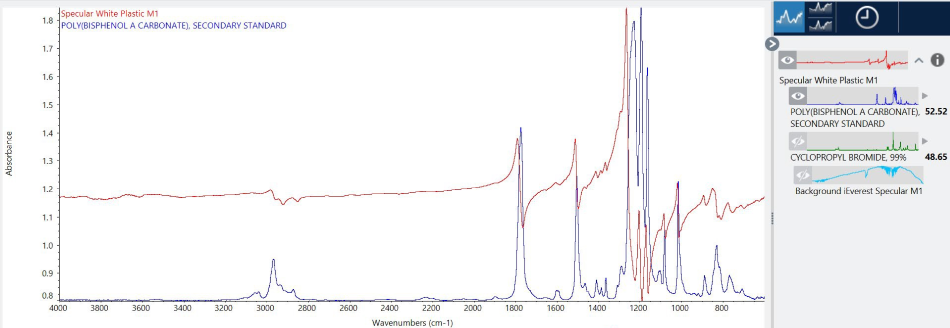
The specular reflectance spectrum collected with the Everest accessory from a white piece of smooth, white plastic is shown in Figure 2. Here, the collected spectrum, in red, looks quite different from the best match value, in blue. The Thermo Scientific™ OMNIC™ Paradigm Software calculated a match value of only 52.5. This is very low, suggesting that the two spectra are from different materials.

Figure 2. Specular reflectance spectrum (red) from a white piece of plastic and the library spectrum from the best search result.
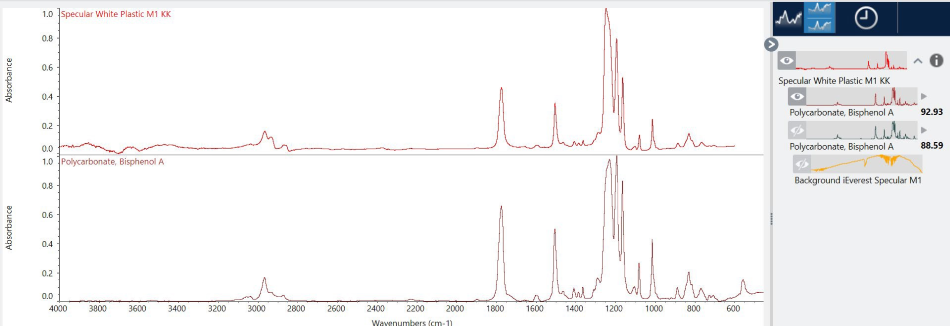
Much of the spectral distortion resulting from the specular reflectance measurement is mathematically eliminated with the Kramers-Kronig correction in the OMNIC Paradigm Software. A spectrum is also created that looks as if it were collected in transmission.
The corrected spectrum, in red, overlaid with the top match value, in purple, is shown in Figure 3. The match value increases dramatically to 93 once the Kramers-Kronig is applied, indicating that the sample is most likely a polycarbonate plastic.

Figure 3. Spectrum after Kramers-Kronig corrections and library spectrum from the best search result.
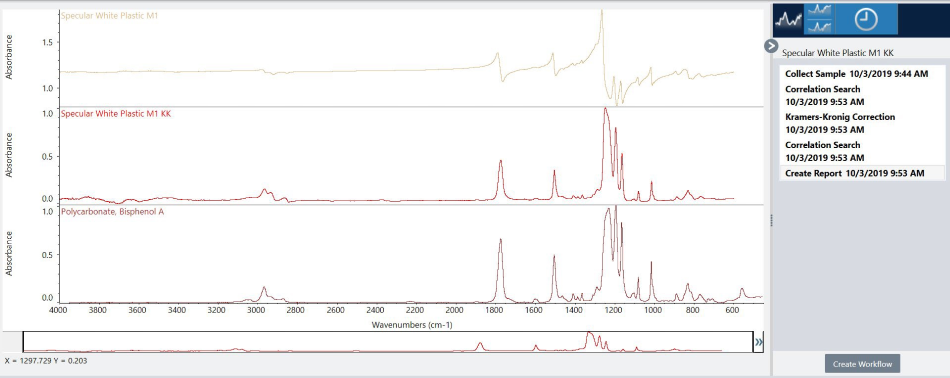
The OMNIC Paradigm Software can speed up future analyses by automatically creating a workflow, similar to a Standard Operating Procedure, ensuring consistent results from one analyst to the next. The actual processing steps completed for the spectral reflectance spectrum, including the Kramers-Kronig correction, are displayed to the right-hand side of Figure 4. The workflow is automatically created for future use (Figure 5) by clicking on the Create Workflow button at the bottom right-hand side of Figure 4.

Figure 4. Comparison of the original spectrum from the white plastic, the KK corrected spectrum and the best library match.

Figure 5. The workflow resulting from clicking on “Create Workflow” button.
A fully functional workflow is automatically created by the OMNIC Paradigm software.
Lab managers may sometimes require additional functionality in the workflow in order to improve it. As shown in Figure 6, a more robust workflow is achievable with a few additional features (or Tiles):
- Instruction tile – Sample information, such as the name and batch number, needs to be entered by the operator.
- Save Results tile – The spectra and results are archived to a specified file location
- Repeat tile – A loop is added so that multiple samples can be analyzed at once

Figure 6. Final Workflow with enhancements.
Several useful features are included with OMNIC Paradigm Software to make analysis easy. Spectral distortions can be removed from diffuse reflectance measurements through the application of the Kramers-Kronig correction, which significantly improves the library match value from around 50 to greater than 90. The steps can be simplified for any scientist or technician in the lab as the process of collecting a spectrum, applying the Kramers-Kronig correction, and successfully searching a library can be automated into a Workflow.

This information has been sourced, reviewed and adapted from materials provided by Thermo Fisher Scientific – Materials & Structural Analysis.
For more information on this source, please visit Thermo Fisher Scientific – Materials & Structural Analysis.