The objective of the experiment was to separate compounds in an unknown mixture using acid/base extraction to analyze the purity of the extracted compound using FTIR spectroscopy.
Materials Required
| . |
. |
. |
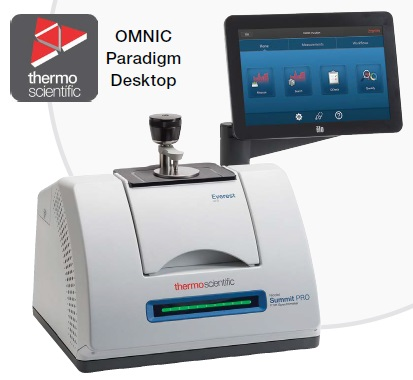
| FTIR Spectrometer with ATR |
Boiling stick & hot plate |
Isopropyl alcohol |
Unknown sample
(mix of acid and neutral compounds) |
Analytical balance |
100 mL beaker |
| Graduated cylinder |
Funnel |
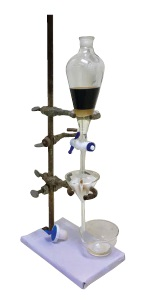
125 mL separatory funnel |
| Stand & ring |
Ethyl acetate |
1.5 M NaOH (aq) |
| DI water |
Saturated NaCl solution |
125 mL Erlenmeyer flask |
| Anhydrous Na2SO4 |
Filter paper |
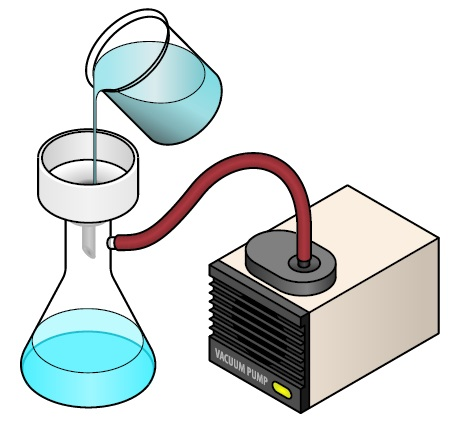
Vacuum funnel |
Introduction
- The transfer of a solute from one phase/layer to another is known as extraction. Compounds can be separated into different layers through the manipulation of the acid/base chemistry. For the purpose of this experiment, acid/base chemistry was used to manipulate which component was soluble in water. This allowed the components to be separated into an organic layer and an aqueous layer.
Discussion
- An unknown mixture comprising of a neutral compound and an acid compound was used for the purpose of this experiment. The neutral compound was uncharged, meaning that it would not dissolve in water. It would, however, dissolve in organic solvents such as ethyl acetate. The acid compound could also dissolve in the organic solvent and could be manipulated with acid/base chemistry to turn it into an ion by adding NaOH. The acid compound could be dissolved in water once it was ionized. With the addition of HCI, the acid compound could then be shifted back into the organic phase, removing the charge on the compound.
- There were two layers in this experiment - the aqueous layer (composed of water) and the organic layer (composed of ethyl acetate). In layer ID density is a very important factor as the denser solution will be on the bottom.
- To prevent solutes in the water from contaminating the final product, all the water was removed from the organic phase by drying the extracts. Through an osmotic effect, saltwater was used to remove any leftover water. Anhydrous Na2SO4 was used as a drying agent to ensure that all traces of water were removed from the organic layer and the final product was as pure as possible.

Experiment
First Lab Period
- The sample of unknown mixture was obtained.
- The analytical balance was tared with a weigh boat on the balance. The contents of the vial were added to the weigh boat and the weight recorded.
- The unknown was transferred to a 100 mL beaker.
- 20 mL ethyl acetate was added to the beaker and stirred well until the unknown was fully dissolved.
- A funnel was used to transfer the solution to a 125 mL separatory funnel. The beaker was rinsed with two 10 mL portions of ethyl acetate and added to the separatory funnel.
- 10 mL of 1.5 M NaOH (aq) was added to the separatory funnel and shaken. The aqueous layer was removed. The beaker was saved and labelled “Aqueous Layer” before the process was repeated.
- 10 mL of DI water was added to the organic layer in the separatory funnel and shaken. The aqueous layer was removed before being combined with the aqueous solution from Step 6.
- 15 mL of saturated NaCl solution was added to the organic layer in the separatory funnel in order to dry the layer. The lower aqueous layer was drained and discarded.
- The organic layer was drained from the separatory funnel into a 125 mL Erlenmeyer flask. Anhydrous Na2SO4 drying agent was added until there was no clumping of the Na2SO4.
- The Na2SO4 was filtered out into a pre-weighed 100 mL beaker using filter paper and a vacuum flask.
- The Erlenmeyer flask was rinsed with 3-5 mL of ethyl acetate and poured into the same filter.
- The solvent was removed by placing a boiling stick in the 100 mL beaker.
- The beaker was placed on a hot plate and the organic layer (solvent) boiled off.

Aqueous Layer
- Concentrated HCl was added dropwise to the labeled aqueous layer beaker until the solution tested acidic on litmus paper. Then, a few drops of HCl were added in excess. A check was then done for complete precipitation.
- 30 mL ethyl acetate was added and extracted (by shaking separatory funnel).
- The aqueous layer was drained and discarded.
- 15 mL of saturated NaCl solution was added to the organic layer in the separatory funnel in order to dry the layer. The lower aqueous layer was removed and discarded.
- The organic layer was drained from the separatory funnel into a 125 mL Erlenmeyer flask. Anhydrous Na2SO4 drying agent was added until there was no clumping of the Na2SO4.
- The Na2SO4 was filtered out with filter paper and a vacuum flask into a pre-weighed 100 mL beaker.
- The Erlenmeyer flask was rinsed with 3-5 mL of ethyl acetate and poured into the same filter.
- The solvent was removed by placing a boiling stick in the 100 mL beaker.
- The beaker was placed on a hot plate and the organic layer (solvent) boiled off. Both solid components were saved in separate labeled vials for the next lab.
Second Lab Period
Initial Analysis Without Search
- A small amount of the initial unknown was obtained.
- The ATR crystal was cleaned with isopropyl alcohol. Note that it is important that a Kimwipe is not used to clean the crystal to prevent scratching the crystal. A paper towel was used instead.
- The Paradigm software was open in desktop mode. On the dashboard, a Measurement name was entered under “New measurement”.
- The final format, sample scans and resolution were set to class specifications.
- “None” was selected for the analysis type.
- “Preview and Measure Background” was clicked on followed by “Start Background Measurement.”
- Once the background measurement had been completed, the initial unknown was placed on the crystal, ensuring there was enough sample to fully cover the crystal.
- The pressure tower was lowered by rotating the knob clockwise until a “click” was heard.
- “Measure Sample” was clicked on to begin analysis of the sample.
- “File” then “Export” was selected before saving to the class network folder.
- The unknown sample was removed from the ATR crystal and the crystal surface cleaned with isopropyl alcohol and a paper towel.
- Steps 1–10 were repeated with the solid neutral component and the solid acid component until there were three spectra in total.

Summit with Everest ATR accessory connected to network.
After Obtaining Spectra
Data Interpretation – OMNIC Paradigm
- In OMNIC Paradigm, spectral data was automatically saved in the “Measurements” section on the Dashboard after acquisition.
- The goal was to overlay the neutral and acid component spectra with the initial unknown spectrum to obtain a rough estimate of the purity of the components.
- The three spectra (neutral component, acid component, and unknown) were found on the Measurements section. Control was held whilst selecting the spectra, followed by a right click then “Open Selected Measurements.”
- The eye icon on the right hand side was clicked to select or deselect a spectrum.
- Functional groups and structures in the spectra of the components were identified to help determine the identity of the components.
- The assumptions about the identity were stated along with the purity of each component.
Utilizing Search for Data Interpretation
- The measurement corresponding to the solid neutral component was selected under “Measurements” on the Dashboard and opened by double clicking it.
- Once opened, the spectrum was in the spectral view. Next, in the “Identify” menu, “Correlation Search” was selected.
- Once the search was completed the spectral pane displayed the sample spectrum as well as the best matched spectrum from a library. Note that the best matched spectrum should be the identity of the component.
- Steps 1–3 were repeated for the solid acidic component.
- The Dashboard was brought back up once the components had been matched.
- From there, the measurement corresponding to the initial unknown was selected and opened.
- “Identify” was selected followed by “Multi-Component Search.”
- Once the search had been completed the spectral pane displayed the sample spectrum as well as the best-matched composite set of spectra.
After Search is Complete
Questions that were considered were as follows:
- What is the identity of each of the components?
- Did the multi-component search results match the ID of the extracted components?
- Do the components appear to be pure, or are there other contaminants? Are the components still somewhat mixed together?
- What is total percent recovery?
- (Total % recovery = %A + %B)
- %A = (weight A/starting weight of unknown) * 100

This information has been sourced, reviewed and adapted from materials provided by Thermo Fisher Scientific – Materials & Structural Analysis.
For more information on this source, please visit Thermo Fisher Scientific – Materials & Structural Analysis.