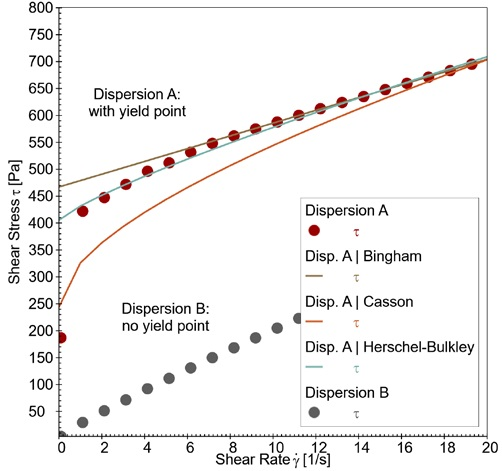
Yield points and flow points are important parameters for characterizing the behavior of dispersions during transport and application. In this case study, yield points and flow points of two dispersions are determined via flow curves in rotation, and amplitude sweeps in oscillation, respectively. Yield points derived from flow curves strongly depend on the regression analysis used, whereas amplitude sweeps provide distinct, typically lower values for flow points.
Introduction
Both the yield point (in rotation), and the flow point (in oscillation) represent the threshold shear stress above which a material, which is solid at rest, will start to flow. It is important for designing transport, storage and application processes, such as pumping or spraying. Suitable measurement protocols for different material types are specified as DIN and ISO standards; see Mezger1 for a comprehensive list of standards, e.g. DIN 911432.
However, as yield points and flow points are not material constants, they depend on the test definitions, the device, as well as on the type of the applied regression analysis. Typically, yield points determined in rotation display higher values compared to oscillation.
In this application report, we present an example from industry with measurements on two dispersions. We show how yield point and flow point determination is influenced by the test definition and the type of regression analysis.

Figure 1: Flow curves were measured from 0.1 to 50 s-1 (20 to 2 s measurement point duration). Best fit curves for Bingham, Casson and Herschel-Bulkley regression analyses are shown.

 Want to know more? Click here to read the full article.
.jpg)
This information has been sourced, reviewed and adapted from materials provided by Anton Paar GmbH.
For more information on this source, please visit Anton Paar GmbH.