Steel is one of the most widely used materials in society, and global rates of steel production continue to grow. Growing demand has caused production rates to reach ~1,550 Mt/y.
The majority of raw iron is made using blast furnaces and necessitates the implementation of high temperatures and high-quality coke. There is an alternative process that requires lower energy demands and the quality of fuel. This process is the direct reduction of iron (DRI) and makes up ~75 Mt/y of iron.
The iron produced by DRI is spongy, and is processed further by sintering in order to obtain more compact and more easily transportable hot briquetted iron (HBI). Hot briquetted iron is then molten by arc furnaces, for example, to create steel alloys.
Controlling the Quality of Direct Reduced Iron and Hot Briquetted Iron
To ensure the quality of the starting iron ore sinters and the resulting DRI and HBI, it is necessary to measure the metallization (total iron Fe(total) and metallic iron Fe(metallic)), and the Fe2+ content. These methods are typically not accessible by common spectroscopic methods. As a result, time-intensive wet chemistry is used instead.

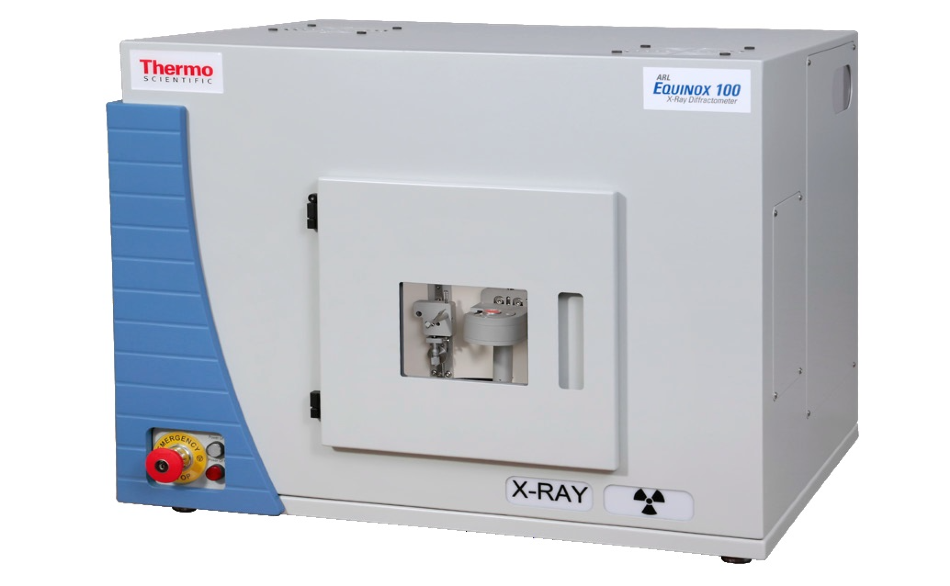
Figure 1. ARL EQUINOX 100 X-ray Diffractometer. Fast, real-time, and convenient.
But, rietveld refinements of easily obtainable X-ray diffraction (XRD) patterns offer a new route to obtain these measurements. With this, there is the possibility to conveniently determine both FeO(total) content and metallization in a typical process control environment.

About the ARL EQUINOX 100 X-Ray Diffractometer
The Thermo Scientific™ ARL™ EQUINOX 100 X-ray Diffractometer uses a custom-designed Cu (50 W) or Co (15 W) micro-focus tube with mirror optics. External water chillers or other peripheral infrastructure is no longer needed because of the low-wattage system. This allows the instrument to be transported between labs, or from the laboratory to the field easily.
The ARL EQUINOX 100 Diffractometer (cf. Figure 1) provides very fast data collection times compared to other conventional diffractometers. This is due to the unique curved position sensitive detector (CPS), which simultaneously measures all diffraction peaks in real-time.
Case Study
Fine-powdered sinter and HBI samples were measured in reflection geometry using Co Kα radiation for five minutes. Qualitative and quantitative analysis (Rietveld refinement) was carried out with MDI JADE 2010 and the ICDD PDF4+ database.
Results
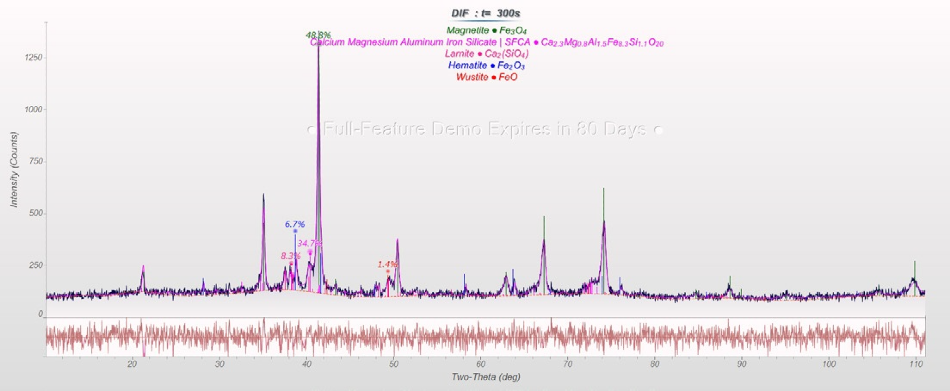
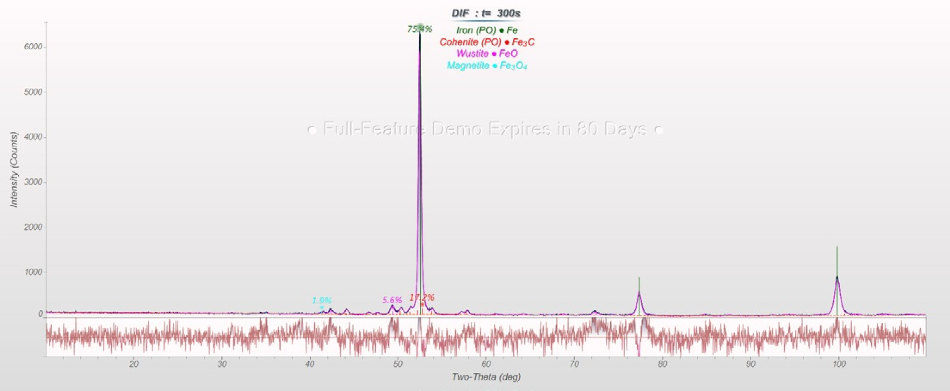
Rietveld refinements of sinter (cf. Figure 2) and HBI (cf. Figure 3) yield the amount of the important phases that facilitate the calculation of FeO(total) concentration and metallization in the DRI process (cf. Table 1).
The sinter sample contains FeO(total) = 16.5 percent, and the HBI sample shows Fe(total) = 97.1 percent, Fe(metallic) = 91.4 percent (with Fe3C part, frequently included in the calculation as metallic Fe) and C = 1.2 percent.
As expected with samples such as those used in this article, the values are in the range.

Figure 2. Rietveld refinement of a sinter sample. Image Credit: Thermo Fisher Scientific - Elemental Analyzers and Phase Analyzers

Figure 3. Rietveld refinement of an HBI sample.
Table 1. Results of the Rietveld refinements of sinter and HBI samples.
| Phase (in wt%) |
Sinter |
HBI |
| Fe |
- |
75.4 |
| FeO |
1.4 |
5.6 |
| Fe3O4 |
48.8 |
1.9 |
| Fe2O3 |
6.7 |
0 |
| Fe3C |
- |
17.2 |
| SFCA* |
34.7 |
- |
| Larnite (Ca2SiO4) |
8.3 |
- |
*silico-ferrite of calcium and aluminum
Summary
Utilizing the ARL EQUINOX 100 Benchtop X-ray Diffractometer alongside the MDI JADE 2010 software suite and ICDD pdf4+ database is an appropriate solution to expediently determine FeO(total), Fe(total) and Fe(metallic) in sinter and HBI samples.
These types of analyses are frequently done in production lines for routine operation by the users, it is important that an accessible method using a rugged instrument, such as the ARL EQUINOX 100 Benchtop XRD, is available.
With this infrastructure, the data processing process can be entirely automated to optimize the workflow and reduce the chance of manual errors occurring, improving productivity and quality as a result.
Acknowledgments
Produced from materials originally authored by Dr. Simon Welzmiller from Thermo Fisher Scientific.

This information has been sourced, reviewed and adapted from materials provided by Thermo Fisher Scientific - Elemental Analyzers and Phase Analyzers.
For more information on this source, please visit Thermo Fisher Scientific - Elemental Analyzers and Phase Analyzers.