It has been common knowledge since the 1950s, that coal-burning power plants produce hazardous amounts of gaseous and particulate pollutants into the atmosphere, such as SO2, NO2, NO, soot and ash.

There has been a good amount of progress over the past 70 years, which has seen emissions-reducing and air quality improving, especially in Europe and the United States.
For example, the Clean Air Act (CAA) was passed in the United States in 1963, giving the Environmental Protection Agency (EPA) the authority to take tangible action to improve air quality, therefore promoting public health.
While the CAA has been amended multiple times (1970, 1977, 1982, and 1990) to increase the EPA’s legislative power, a 2013 study undertaken at the Massachusetts Institute of Technology (MIT) revealed that air pollution is still responsible for around 200,000 deaths annually, in the United States alone.1
The developing world continues to industrialize, seeing the demand for energy increase rapidly. This is especially the case in places like India and China.
While cleaner technologies are able to serve a portion of the global market, approximately 40 % of the world’s electricity generation still comes from coal-burning power plants. In countries such as India and China, this can be as high as 70 to 75 %,2 meaning that environmental monitoring systems are as vital today as always.
Continuous Emission Monitoring Systems
From the CAA’s early days, engineers have been working on ways to purify smoke stack exhaust with techniques such as electrostatic precipitation,3,4 however, the real-time monitoring of gaseous pollutants has, historically, proven to be far more challenging.

Air pollution monitoring station.
Thanks to advances in optical sensing technologies over the past two decades, engineers have been able to develop a continuous emission monitoring system (CEMS), utilizing absorption spectroscopy.
Gasses possess absorption bands in both the UV/Vis (electronic) and infrared (vibrionic) regions of the spectrum, much any other covalently bound molecule. There are advantages and disadvantages to working in both of these regimes.
Standoff infrared absorption techniques which operate both in the near-infrared (NIR) and mid-infrared (MIR) range must employ tunable laser sources to function. These may include distributed Bragg reflectors (DBRs) or quantum cascade lasers (QCLs), used alongside HgCdTe and InGaAs photodetectors.
Processes such as tunable diode laser absorption spectroscopy (TLDAS) and differential absorption lidar (DIAL) allow NIR and MIR absorption spectroscopy to provide precise quantization of molecular species.
A considerable disadvantage to this approach is that, in the majority of cases, each species of interest will necessitate the use of a different excitation laser, adding to an already expensive component cost.
In contrast, the use of optical absorption spectroscopy (DOAS) means that UV/Vis absorption can be employed to measure a diverse array of molecular species via a single broadband light source.
DOAS lowers the cost of multi-species detection, while also being much less expensive for single species detection due to its use of a constant current D2 emission lamp and inexpensive CCD spectrometers.
In a large number of cases, it is even possible to perform DOAS using sunlight, though this is generally not recommended for CEMS due to the inherent fluctuations in levels of sunlight.
Differential Optical Absorption Spectroscopy
According to reports, DOAS was first used for atmospheric measurements in 1973. Here, it was employed in the monitoring of NO2 concentrations by monitoring absorption bands between 430 nm and 450 nm,5 however, as previously mentioned, it was not until the introduction of contemporary CCD based spectrometers that this technique was able to achieve commercial viability.
DOAS is now performed by recording two absorption spectra: a reference scan taken through a column of atmosphere ideally devoid of an analyte, and a second scan through an identical pathlength which does contain the analyte.

Vehicles on a congested highway.
This article does not have the scope to outline the mathematical treatment of DOAS in any great detail, but it is necessary to point out that by taking the difference of these two spectra and applying the Beer-Lambert Law, the resultant differential spectrum is solely dependent on the absorption cross-section of the species in the analyte, as well as the difference between the column densities of the reference spectrum and species.6
Because the cross-section may be represented as the sum of a slowly changing and quickly verifying function, the differential spectrum enables the separation of both of these components.
Additionally, because both Rayleigh and Mie scattering are slowly changing functions, employing the differential spectrum alongside mathematical tools such as a Fourier Transform filter removes both scattering and attenuations from the data.7
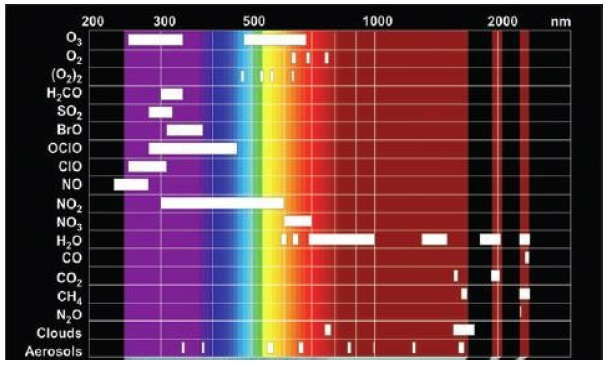
Figure 1 displays the absorption bands of an array of commonplace atmospheric pollutants, including the NO, NO2, and SO2 previously mentioned. It is clear from this chart that it is possible to detect the majority of molecular species (with the notable exceptions of CO and CO2) from 200 nm to 460 nm.

Figure 1. Absorption bands of common atmospheric species.
It is, therefore, possible to use a single compact fixed grating spectrometer as part of a DOAS-based CEMS. It should be noted that when selecting a spectrometer to measure in the UV region of the spectrum, it is imperative that an ultra-low stray light configuration is used to minimize stray light in the system.
While they are compact, cross Czerny-Turner spectrograph designs do tend to have inherently higher incidences of stray light than transitional Czerny-Turner spectrographs.
The AvaSpec-ULS2048XL-EVO and AvaSpec-ULS2048X64-EVO from Avantes are examples of ultra-low stray light spectrometers. Both instruments feature the company’s ultra-low stray light design, as well as back-thinned CCD detectors which offer enhanced UV sensitivity and signal to noise.
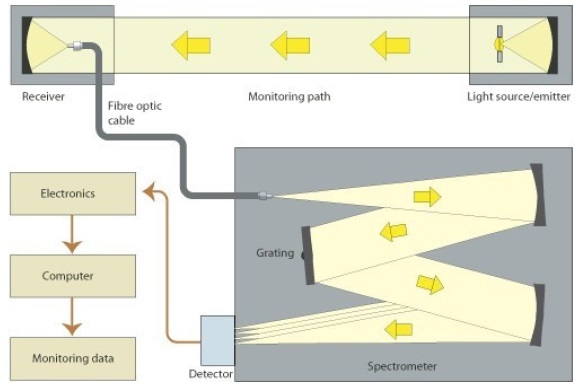
Figure 2 displays a common CEMS setup for DOAS. Here, a concave mirror is utilized to collimate a broadband light source (usually a D2 lamp) across the monitoring path. Another concave mirror is used to couple the transmitted light into a fiber optic cable, which then directs it into the spectrometer.

Figure 2. Typical CEMS setup, using DOAS.
Additional DOAS Applications
Sunlight-based DOAS is also commonly used alongside CEMS for general environmental monitoring.
In one such example, a team of Greek scientists presented data at the 2015 conference Advances in Atmospheric Science and Applications, where they employed a mini multiaxis (MAX) DOAS system to measure tropospheric column densities of HCHO, NO2 and SO2 in rural, urban and suburban sites around Thessaloniki in Greece.8
The min-MAX-DOAS system that they used was an AvaSpec-ULS-TEC spectrometer from Avantes. This had been configured from 300 nm to 450 nm. Three systems were deployed, with one using a 25-micron entrance slit with a ~0.25 nm resolution, and the other two utilizing a 50-micron entrance slit with ~0.38 nm resolution.
Another group at the Max Planck Institute in Germany used a similar mini MAX-DOAS system which was based upon an Avantes spectrometer, in order to collect similar measurements in Germany and Romania.9
Instrument Selection
As societies around the globe continue to expand, so does the need for clean technologies, especially the effective monitoring of environmental pollutants via both CEMS and field-based DOAS systems.
In both instances, these applications need stable, high resolution, sensitive, low stray light spectrometers, in order to provide reliable, accurate DOAS measurements with high signal-to-noise ratios and low detection limits.
The Avaspec-ULS optical bench provides the highest level of stability and the lowest amount of stray light of any miniature spectrometer currently available, while the option to use either a CMOS or back-thinned CCD detector offers users the flexibility to balance cost and sensitivity effectively.
The Avantes ULS2048 series spectrometers are among the most highly recommended back-thinned instruments, offering remarkable performance. The AvaSpec-ULS2048XLEVO delivers an extra-large 14x500 micron pixels resolution which provides the first-rate efficiency in both the UV range (200-400 nm) and the NIR (950-1160 nm). Its internal shutter enables in-line dark capture integration times which are as low as 2 microseconds.
The uncooled AvaSpec-ULS2048x64-EVO also has a proven track record for DOAS applications, thanks to its high UV response, fast integration times, and 0.9 mm detector height.
Each of these AvaSpec-ULS series spectrometers can also be provided as OEM modules, meaning that they can be integrated into turnkey industrial or field sensing devices as required. They are also suitable for use as an add-on to existing laboratory equipment setups.
All of these instruments are able to communicate via Ethernet, USB, and the of Avantes AS7010 electronics board’s native digital & analog input/output capabilities, providing excellent interface options with other devices.
Finally, the Avantes AvaSpec DLL software development package includes sample programs in C#, C++, Delphi, LabView, Visual Basic, MatLab, and a range of other programming environments, enabling the user to develop code for their own applications as required.
References and Further Reading
- Caiazzo, Fabio, et al. “Air pollution and early deaths in the United States. Part I: Quantifying the impact of major sectors in 2005.” Atmospheric Environment 79 (2013): 198-208.
- G, Karen. “What Are Smoke Stacks?” sciencing.com, https://sci- encing.com/info-8068108-smoke-stacks.html. 23 March 2020.
- Marks, Alvin M. “Smokestack aerosol gas purifier.” U.S. Patent No. 3,520,662. 14 Jul. 1970.
- Kirchhoff, Franz-Josef, and Joachim Brandt. “Electrostatic precipi- tator.” U.S. Patent No. 4,097,252. 27 Jun. 1978.
- Brewer, A. W., C. T. McElroy, and J. B. Kerr. “Nitrogen dioxide con- centrations in the atmosphere.” Nature 246.5429 (1973): 129-133.
- U. Platt (1994), “Differential optical absorption spectroscopy (DOAS),” in Air Monitoring by Spectroscopic Techniques, M. W. Sigrist, ed.,Chemical Analysis Series, vol. 127, pp. 27–84.
- Haiming, Zheng. “Experiment study of continuous emission monitoring system based on differential optical absorption spectros- copy.” 2008 International Workshop on Education Technology and Training & 2008 International Workshop on Geoscience and Remote Sensing. Vol. 1. IEEE, 2008.
- Drosoglou, Theano, et al. “Retrieval of tropospheric columns from ground-based MAX-DOAS measurements performed in the greater area of Thessaloniki and comparison with satellite products.”
- Riffel, Katharina, et al. “NOx emissions of various sources in Romania and the Rhein-Main region in Germany based on mobile MAX-DOAS measurements of NO2.” EGU General Assembly Conference Abstracts. Vol. 18. 2016.
- Experimental Biolgy 49.3 (1969): 669-677
- Riddle, Sharla. “How Bees See and Why it Matters.” Bee Culture: The Magazine of American Beekeeping. (May 20, 2016).

This information has been sourced, reviewed and adapted from materials provided by Avantes BV.
For more information on this source, please visit Avantes BV.