As "food safety" is acknowledged as an ever-increasing and essential issue globally, many nations determine their own regulations where residual agricultural chemicals in food are concerned.
In Japan, the positive list system, which was enforced at the end of May 2006, specifies a consistent standard of 10 ppb as a quantity that is deemed as safe for human health. According to the positive list system, there are many more agricultural chemicals that need to be examined, and as a result, methodologies capable of collectively analyzing residual agricultural chemicals in food with precision and accuracy are growing in demand.
While mass spectrometry (MS) is recognized for its high detection sensitivity, MS/MS is becoming the standard of pesticide analysis for its excellent sensitivity and superior selectivity. The JMS-TQ4000GC, JEOL’s latest GC-MS/MS system, has a novel ion storage/ejection mechanism within the MS/MS collision cell and integrates new firmware to support MS/MS analysis with up to 36,000 transitions. This article details the results verified for pesticide residues sensitivity in food using the JMS-TQ4000GC.

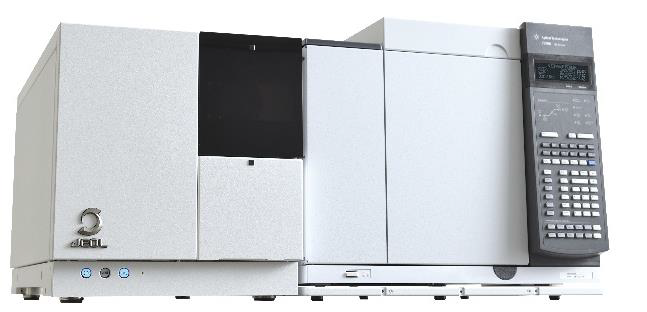
GC-MS/MS, JMS-TQ4000GC.
Experiment
A standard pesticide solution provided by FUJIFILM Wako Pure Chemical Corporation (PL series) was used. The solution consisted of equal parts PL 1, 2, 3, 4, 5, 6, 11, and 12. Subsequently, the solution was diluted to 1, 5, 10, 50 and 100 ppb. PEG 300 was utilized to defend the pesticides against thermal decomposition in the GC injection liner.
Throughout the study, both the sensitivity and the linearity of the calibration curve were examined for 150 pesticides. Table 1 illustrates the measurement conditions employed during the analysis.
Table 1. Measurement conditions.
| . |
. |
| System |
JMS-TQ4000GC (JEOL) |
| Ionization mode |
EI+: 70 eV, 50 µA |
| GC column |
VF-5 ms, 30 m x 0.25 mm, 0.25 µm |
| Oven temp. |
50 °C (1 min)→25 °C/min→125 °C →10 °C/min→300 °C |
| Inlet temp. |
250 °C |
| Inlet mode |
Splitless, 2 µL |
| He flow |
1.0 mL/min (Constant Flow) |
| MS/MS mode |
Peak Dependent SRM |
Results and Discussions
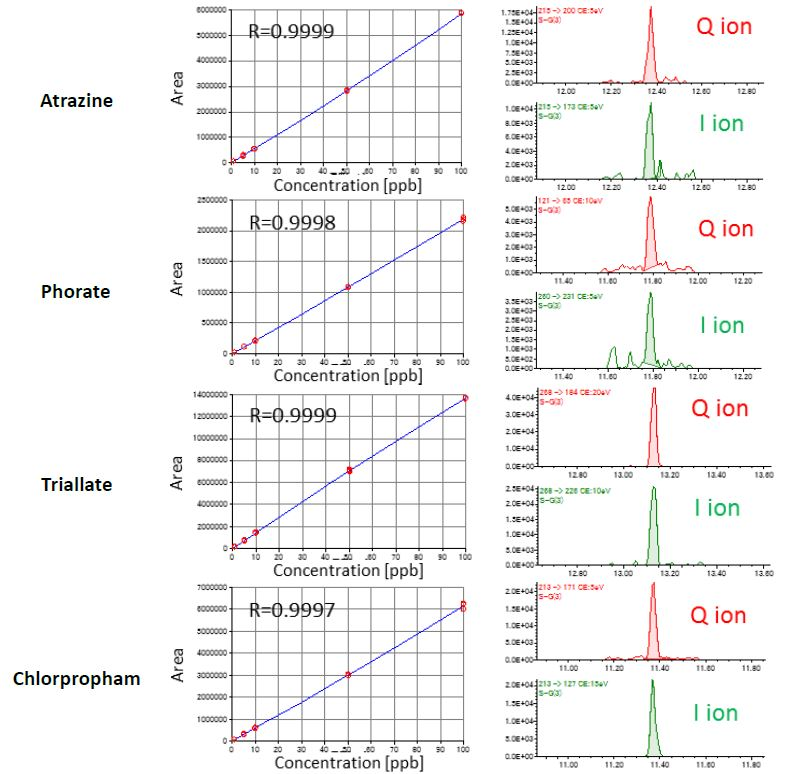
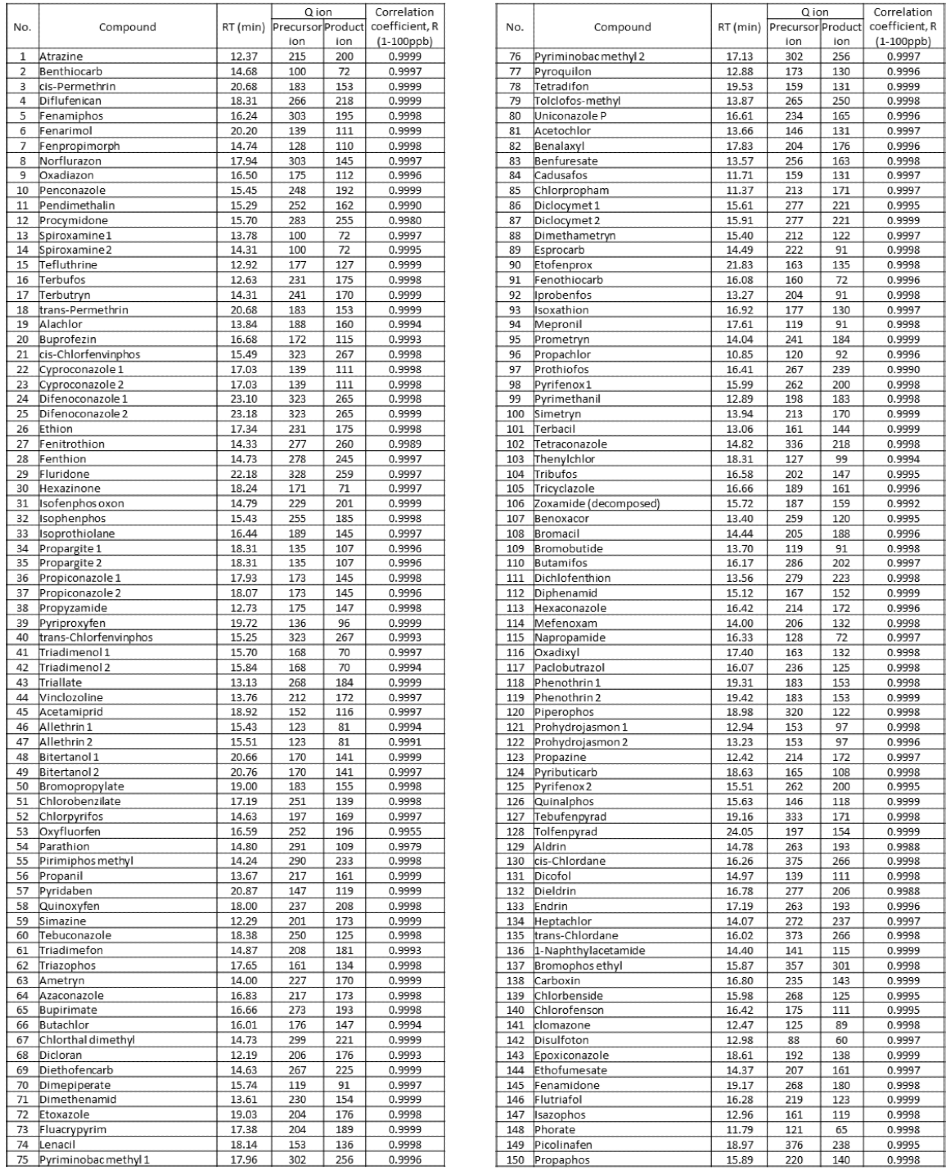
Figure 1 exhibits the calibration curves from 1-100 ppb in addition to the SRM chromatograms for 4 pesticides at 1 ppb. The JMS-TQ4000GC displayed superior linearity and sensitivity regarding the range of concentrations detailed. Fig 2 illustrates the SRM information, retention times (R.T.), and correlation coefficient for 150 pesticide calibration curves. Since the uniform criterion of the positive list system is 10 ppb, when the concentration ratio in the sample pre-treatment is identical, the criteria concentration in the measurement sample for GC-MS/MS is also 10 ppb.

Figure 1. Calibration curves (1-100 ppb) and SRM chromatograms for 1 ppb data.
Several pesticides were identified with excellent sensitivity at 1 ppb, which is 1/10 of criteria concentration. These results imply that the JMS-TQ4000GC is the better and most efficient tool for pesticide analysis.
Table 2. Calibration curve information for 150 pesticides using 1, 5, 10, 50 and 100 ppb standard solutions (n=3 each).


This information has been sourced, reviewed and adapted from materials provided by JEOL USA, Inc.
For more information on this source, please visit JEOL USA, Inc.