A calibration curve has been created in accordance with ASTM D4929 method to show the analysis of chlorine (Cl) in oil. The only difference in method was the use of a rhodium anode tube.
Instrumentation
The powerful and stable Thermo Scientific™ ARL™ PERFORM’X WD-XRF instrument has been employed. An alternative for rapid change-over of the analysis environment from vacuum to helium atmosphere (< 6 min.) is present which enables liquids analysis.
Below the analytical conditions are displayed.
The Analysis of Chlorine in Oils
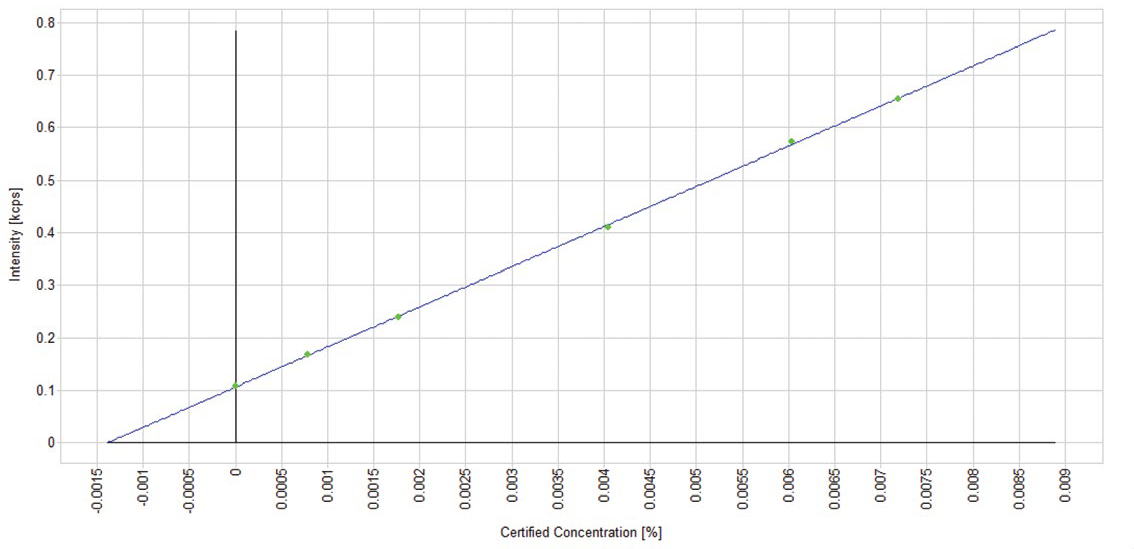
The ASTM D4929 method has been selected for low Cl in oil. For a calibration curve to be created, five standard samples were arranged in accordance with the standard. This method proposes using net peak intensities, therefore a background position was selected.
The background position and the counting time on the Cl peak are the same. From a concentrate product which contained 1000 ppm of Chlorine a mother solution was prepared by diluting this concentrate with Iso-Octane.. Following this, the mother solution was utilized to formulate multiple samples with differing Chlorine concentrations.
Table 1. The Instrument Settings. Source: Thermo Fisher Scientific - Elemental Analyzers and Phase Analyzers
| Instrument |
ARL PERFORM’X |
| Crystal |
Ge 111 |
| Collimator |
0.40 |
| Detector |
FPC |
| kV – mA |
30 – 50 |
| Power |
1500 watts |
| Time / Line 1 |
180 sec |
| Total time |
360 sec |
Each standard net intensity (peak minus background) is linked with the Cl content in ppm, resulting in the calibration curve shown in Figure 1. Table 2 displays the numerical results containing the absolute disparity between nominal and determined concentrations, and the Standard Error of Estimate.
Table 2. Calibration results for five standard samples with low Cl content. Source: Thermo Fisher Scientific - Elemental Analyzers and Phase Analyzers
| Sample # |
Cl intensity |
Nom. conc. ppm |
Calc. conc. ppm |
Absol. diff. ppm |
| 0 |
108 |
0 |
0.3 |
0.3 |
| 1 |
167 |
7.9 |
8 |
0.1 |
| 2 |
239 |
17.7 |
17.5 |
0.2 |
| 3 |
409 |
40.4 |
39.7 |
0.7 |
| 4 |
572 |
60.4 |
61 |
0.6 |
| 5 |
655 |
71.9 |
71.8 |
0.1 |
SEE = 0.51 ppm
Correlation error R2 = 0.999753
Cl in Oil - Low Levels

Figure 1. Cl calibration curve. Image Credit: Thermo Fisher Scientific - Elemental Analyzers and Phase Analyzers
Repeatability Test on Oil Samples Containing Cl
One oil sample with 1.4 ppm level has been utilized for a repeatability test for the analysis of Cl. Six liquid cells were arranged and examined. The results found are listed in the table below.
Table 3. Repeatability test. Source: Thermo Fisher Scientific - Elemental Analyzers and Phase Analyzers
| Sample |
Cl concentration in ppm |
| Cell 1 |
1.2 |
| Cell 2 |
1.5 |
| Cell 3 |
1.2 |
| Cell 4 |
1.5 |
| Cell 5 |
1.2 |
| Cell 6 |
1.8 |
| Average |
1.4 |
| SD |
0.6 |
Conclusion
It is possible to obtain good calibration curves using the ARL PERFORM’X XRF for Cl determination in oil when employing the appropriate ASTM standard method despite the use of a rhodium anode tube. Due to the ARL Perform’X innovative helium shutter shielding the goniometer chamber from the helium environment and the reproducibility of loading, superb repeatability of analysis can be exhibited for Cl analysis at low level.
The results found demonstrate that excellent accuracy and precision is achieved with the ARL PERFORM’X Sequential XRF instrument. This instrument works well for the assessment of Cl in petrochemical products.

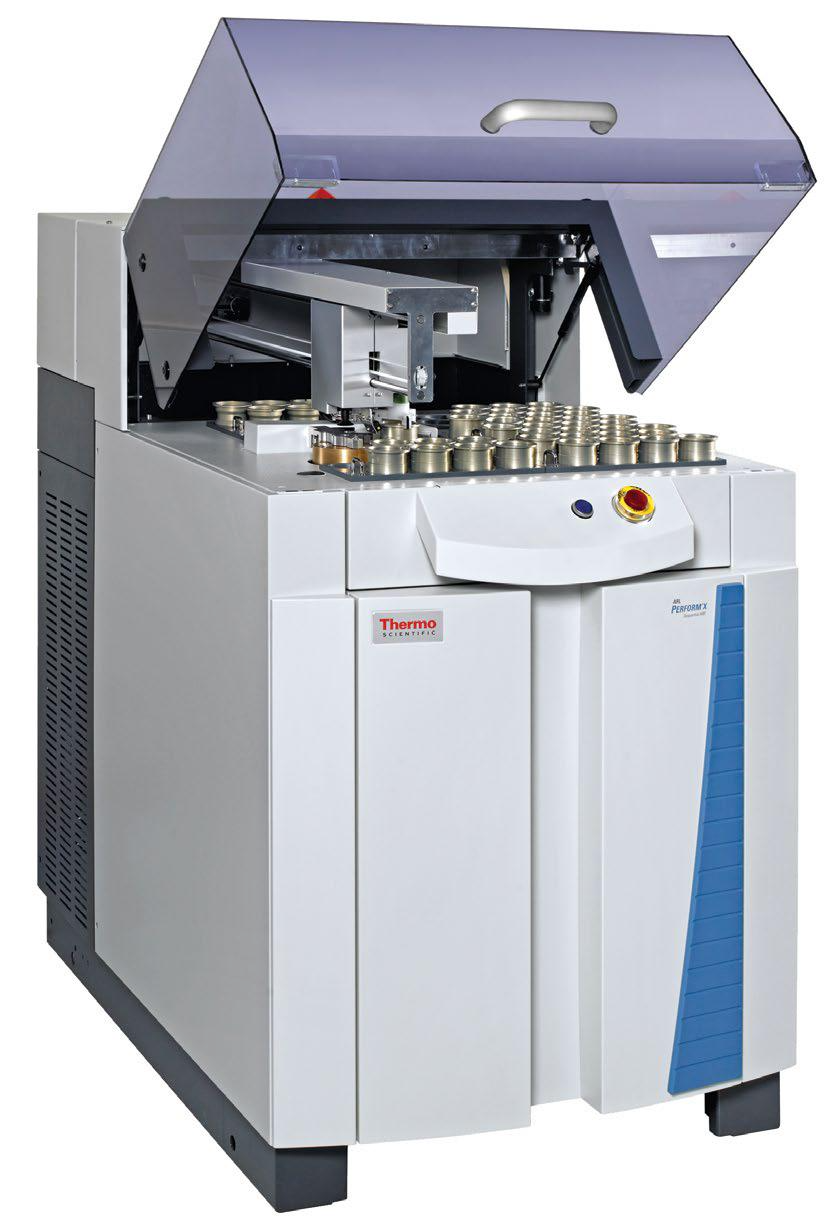
Thermo Scientific ARL PERFORM’X Sequential XRF. Image Credit: Thermo Fisher Scientific - Elemental Analyzers and Phase Analyzers

This information has been sourced, reviewed and adapted from materials provided by Thermo Fisher Scientific - Elemental Analyzers and Phase Analyzers.
For more information on this source, please visit Thermo Fisher Scientific - Elemental Analyzers and Phase Analyzers.