Pigments are coloring materials that are either organic or inorganic. Pigments must meet many technical criteria in the manufacturing process, such as color strength, ease of application, durability or light and weather fastness, all of which are closely related to the size of the pigment particles.
Dynamic light scattering (DLS) technology was used in this study to measure the particle sizes of two high concentration pigment suspensions. A capillary sizing cell with an inner diameter of 1 mm was utilized for the DLS measurement because of the high concentration and poor light transmittance of the sample.
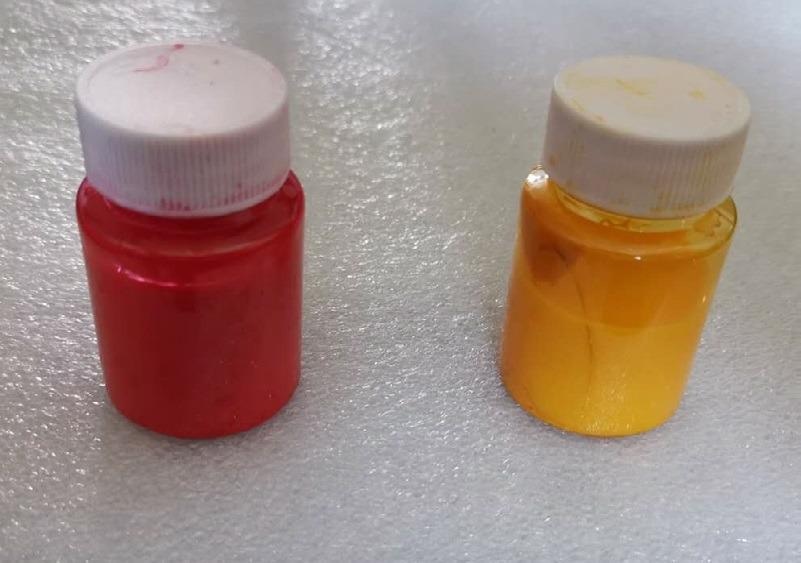
Image Credit: Bettersize Instruments Ltd.
Theory and Instrumentation
DLS quantifies the intensity fluctuations of the sample due to Brownian motions of particles. Using the Stokes-Einstein equation, the diffusion coefficient D is gathered and related to the particle size, i.e., the hydrodynamic diameter DH.

Where kB is the Boltzmann constant, T is the temperature, and η is the dispersant viscosity.
In this article, the pigment samples were characterized by using the BeNano 90 Zeta from Bettersize Instruments Ltd., which uses a 10 mW laser with a wavelength of 633 nm.
In order to maximize the signal-to-noise ratio,single-mode optical fibers are used for signal transmission in the BeNano 90 Zeta; high speed correlators are employed such that the fast-decay correlation functions of small particles can be effectively calculated.
Experiment
In order to perform the particle size measurements, a red and a yellow pigment were pre-dispersed in purified water. Through the built-in temperature control system of the BeNano 90 Zeta the measurement temperature was set to be 25°C ± 0.1°C. To confirm a low standard deviation of the results, each sample was measured a minimum of three times.
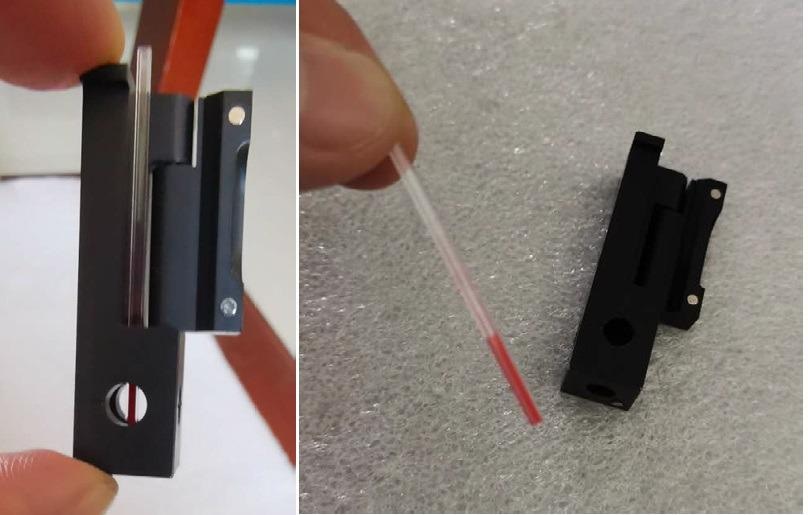
Image Credit: Bettersize Instruments Ltd.
Results and Discussion
Correlation functions of two pigment samples were calculated through their scattered light signals and Figure 1 and Figure 2 show the overlap correlation functions of numerous measurements.
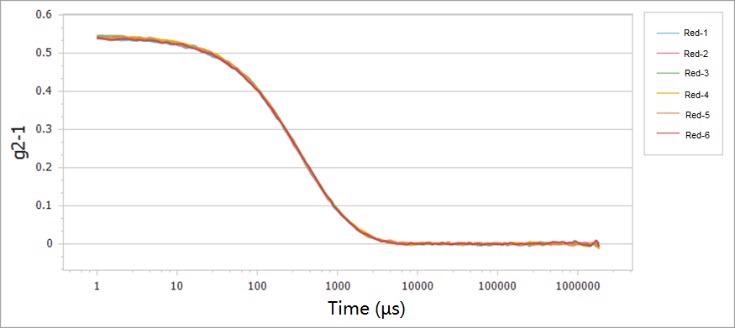
Figure 1. Correlation functions of red pigment sample for six measurements. Image Credit: Bettersize Instruments Ltd.
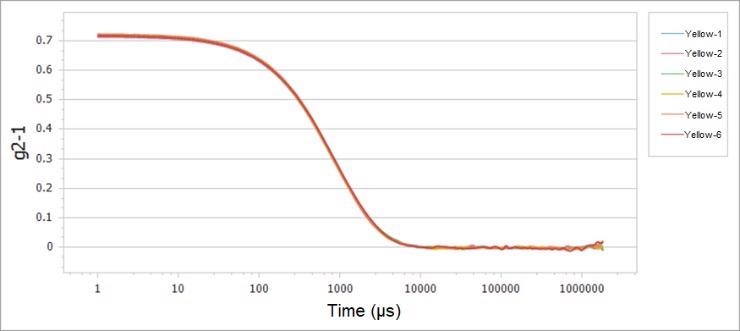
Figure 2. Correlation functions of yellow pigment sample for six measurements. Image Credit: Bettersize Instruments Ltd.
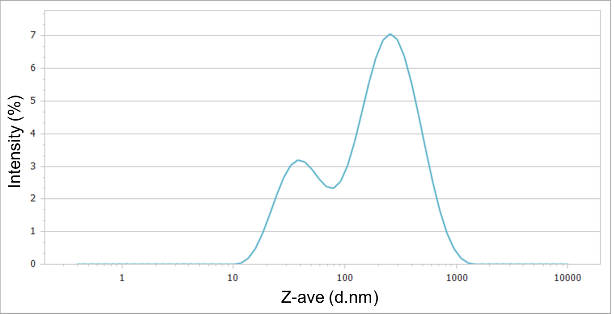
Figure 3. Particle size distribution of red pigment sample. Image Credit: Bettersize Instruments Ltd.
As demonstrated, the repeatability of the correlation function is good, which indicates that the samples remain stable during the measurement. Neither the high concentration nor the color of the samples influenced the measurement results.
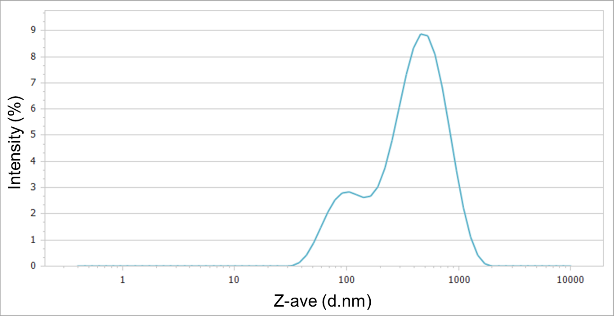
Figure 4. Particle size distribution of yellow pigment sample. Image Credit: Bettersize Instruments Ltd.
Figures 3 and 4 suggest that both particle size distributions of red and yellow pigments were wide, with two peaks detected. The peak of large particles was at hundreds of nanometers, but the peak of small particles was at around 40 nm.
The yellow pigment sample had a larger particle size but a narrower particle size distribution than the red pigment sample, although both pigment samples were nanometer-sized, as can be seen in Table 1.
Table 1. Particle sizes of two pigment samples. Source: Bettersize Instruments Ltd.
| Sample |
Z-ave (nm) |
PdI |
| Red Pigment |
112.49 ± 1.42 |
0.528 |
| Yellow Pigment |
267.54 ± 2.69 |
0.391 |
In conclusion, the DLS technology of the BeNano 90 Zeta successfully characterized high concentration pigments (red and yellow samples).
Acknowledgments
Produced from materials originally authored by Zhibin Guo, Shelly Zhang and Hui Ning from Bettersize Instruments Ltd.

This information has been sourced, reviewed and adapted from materials provided by Bettersize Instruments Ltd.
For more information on this source, please visit Bettersize Instruments Ltd.
