Known as EIS, Electrochemical impedance spectroscopy is an increasingly common non-destructive technique that is used to analyze and identify a material’s physicochemical properties, especially at the solid-liquid (as well as the electrode-electrolyte) interface.
EIS can be used in the study of a range of electrochemical devices – batteries, fuel cells and supercapacitors – dielectric coatings and microfluidic chips, despite the complexity of the measured data.
This article explores the methodology of EIS when using the MFIA impedance analyzer (or MFLI with MF-IA option) and uses a simple and obtainable sample of tap water.
Background
The measurement setup is quite different when it is in a liquid state than it is at solid state. This stems from the difficulty in confining the geometry of DUT. In this article, a capacitive sensing probe is used for demonstration purposes (as is depicted in Ref 1, inductive sensors are not covered here).
As is indicated by the name, the sensing part of the probe consists of a pair of parallel (coated) metal plates and has been designed carefully to have a cell constant (k) of 1 cm (ref 2).
The conductivity (σ) can then be easily calculated from the conductance (G); the former is usually linearly proportional to the ionic concentration in dilute strong electrolytes.

Experimental Setup
The measurement is taken via AC test signal, which emits from the HCur BNC port on the MFIA – this process is due to the nature of the capacitor that blocks DC current. A single-ended conductivity probe is connected using the setup as shown in Figure 1.
Pinning the HCur, LCur, HPot and LPot ports together at the BNC end of the probe is what conducts the 4-terminal measurement. The sensing part of the probe was soaked in tap water overnight before starting the measurement to ensure complete wetting.
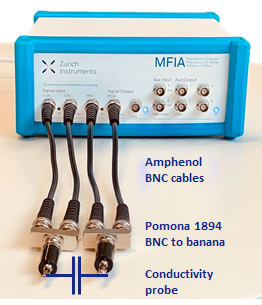
Figure 1. A Scheme showing the setup of MFIA connected to a single-ended conductivity probe. Image Credit: Zurich Instruments
Electrochemical Impedance Spectroscopy (EIS)
The experiment is commenced by setting the AC test voltage as 100 mV in amplitude and sweeping the frequency from 10 mHz to 5 MHz using LabOne software’s ‘Sweeper’ tool. The measured amplitude and phase (Bode plot) can be displayed at the same time for convenience, as displayed in Figure 2 with a simple check of the ‘Dual Plot’ button.
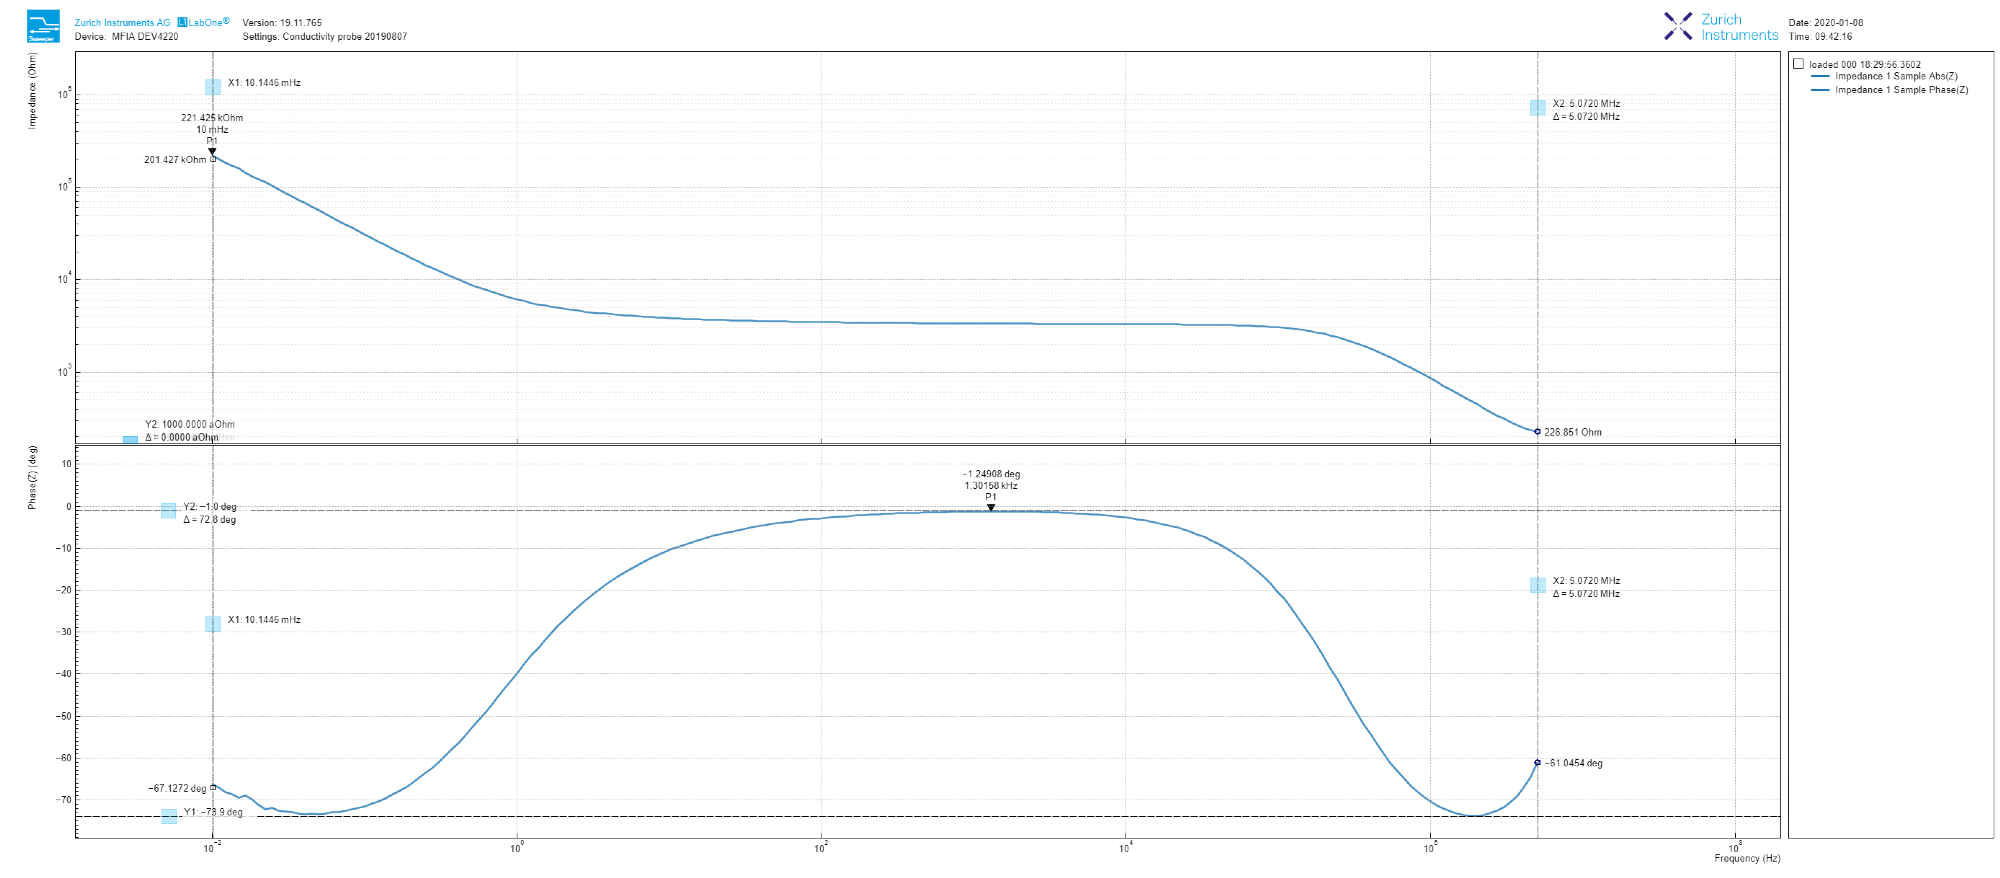
Figure 2. Dual Bode plot derived from the LabOne Sweeper tool, showing both the amplitude and phase of the measured tap water impedance from 10 mHz to 5 MHz. Image Credit: Zurich Instruments
As shown in Figure 3, toggling into Nyquist plot can be as simple as selecting ‘On-Invert’ from the drop-down menu next to ‘XY Mode’ and choosing ‘Impedance 1 Real (Z)’ as the ‘X Signal,’ and ‘IA Imag (Z)’ as Y in the ‘Vertical Axis Groups.’
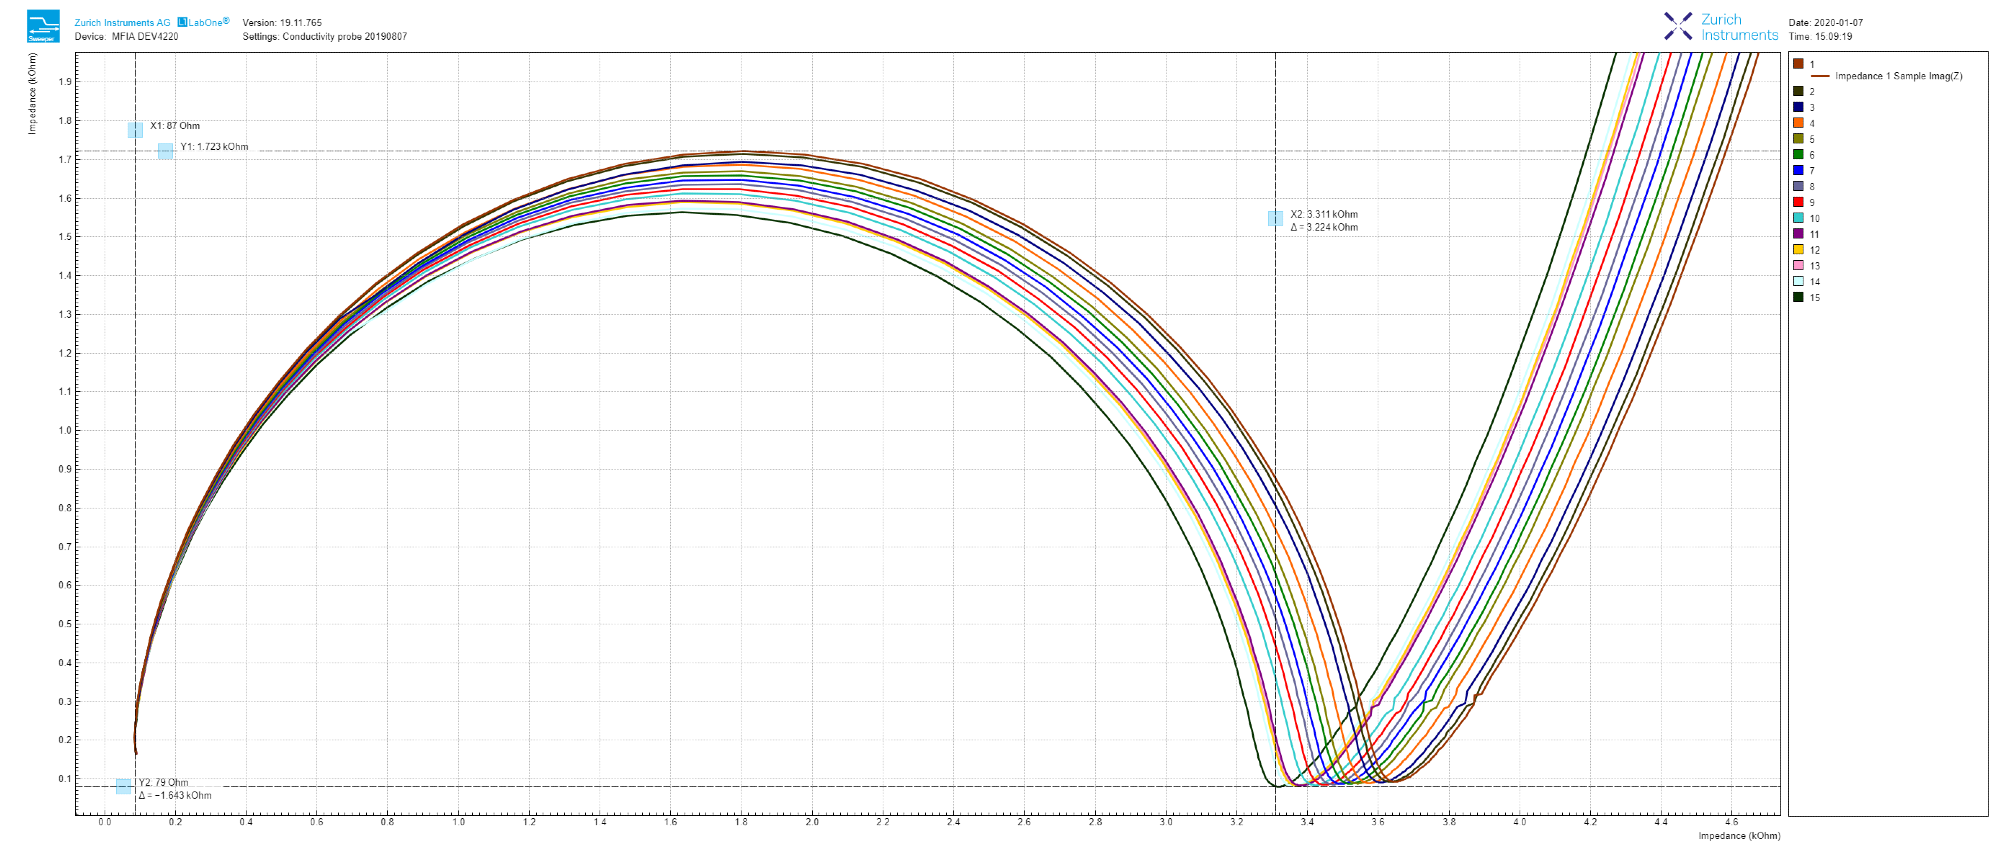
Figure 3. 15 continuous impedance measurements reloaded into LabOne Sweeper module, and zoomed-in at the high-frequency end in the Nyquist plot. Image Credit: Zurich Instruments
As shown in Figure 2, the amplitude decreases at low frequency with a slope that is just higher than -1, flattens within 100 Hz to 10 kHz range and once again returns to a -1 slope at a high frequency. It is important to note that during the sweep, the amplitude decreases by three orders of magnitude.
The sweep can be done smoothly without manually adjusting the input ranges thanks to the auto-ranging function of the MFIA.
In phase terms, we can observe that the 100 Hz to 10 kHz region relates to a small (non-zero) angle (this angle is maximum -1.2 deg at 1.4 kHz). Additionally, the trace never reaches -90 deg (purely capacitive) in the range of measured frequency.
Clearly, the result clearly varies from a simple RC circuit model, which is often used in solid-state DUTs. This result is intriguing and worth examining in depth.
Continuous sweeps were set over a weekend in order to obtain more statistics. It is key to note that measurements from the ‘Sweeper’ (as well as ‘DAQ’ and ‘Scope’) module can be saved in since the LabOne 19.05 release .h5 format, which permits for convenient reloading either for comparison at a later stage.
Each sweep can be automatically stored in either a single or multiple file format by checking the ‘auto-save’ button. Fifteen measurements are taken and reloaded into LabOne in sequential order, as depicted by the Nyquist plot in Figure 3.
The impedance of tap water gradually decreases over time (real-part shifting to the left) which is thanks to slow water evaporation in addition to CO2 dissolution from the room atmosphere (ref 3).
Equivalent Circuit Modeling
The project proceeds with fitting the impedance spectrum with the inset circuit model in Figure 4 to get a meaningful explanation. The MFIA is able to export sweeper data in .csv, .m (Matlab), .h5 (HDF5) and .txt formats, and these can then be loaded into circuit modeling programs.
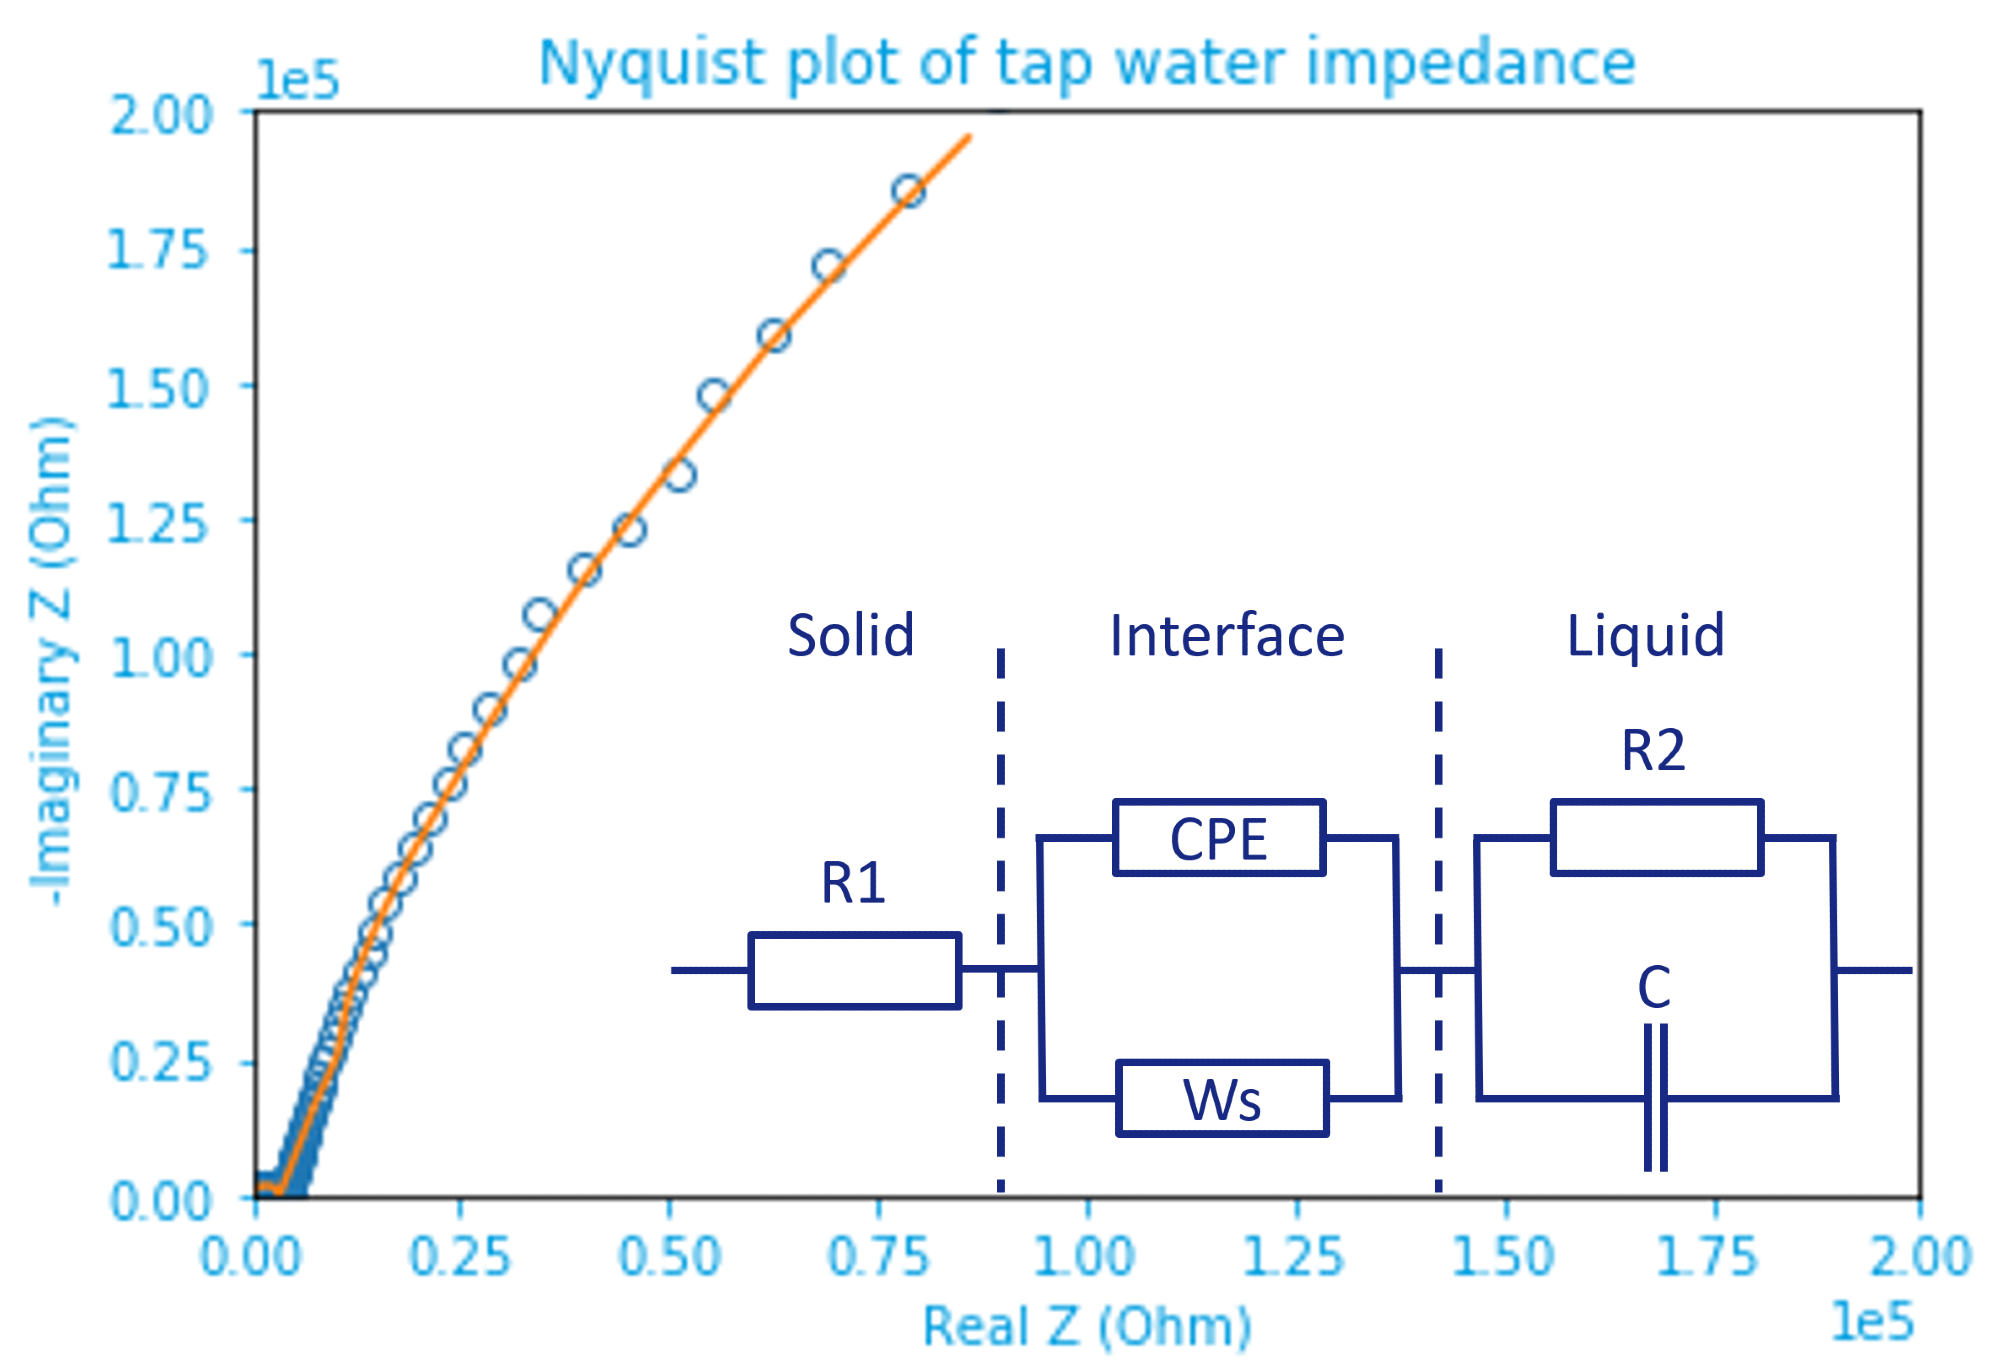
Figure 4. Nyquist plot of tap water impedance fitted by the inset equivalent circuit model. Raw data are marked by open dots and the fitting result represented by an orange line. The inset circuit shows solid(electrode)-liquid(electrolyte) (inter)phases separated by dashed lines. Image Credit: Zurich Instruments
It is important to note that a Kramers-Kronig analysis should be performed in advance of the modeling in order to check the linearity, stability, and casualty of the measured data (Ref 3). Table 1 lists the fitting results.
Table 1. Fitting results of the impedance spectrum in figure 4. Q and n are from the CPE; Zw, τ, and α are from the Warburg short element. For a detailed explanation of the parameters, readers are kindly referred to Ref 5. Source: Zurich Instruments
| Name |
Value |
Error |
| R1 |
80.45 Ohm |
3.2% |
| R2 |
3320 Ohm |
0.29% |
| C |
1.834×10⁻¹⁰ F |
0.58% |
| Q |
4.59×10⁻⁵ Ohm-1 sn |
0.97% |
| n |
0.845 |
0.51% |
| Zw |
1.184×10⁶ Ohm s-0.5 |
11% |
| τ |
7.40 s |
9.6% |
| α |
0.780 |
5.6% |
A modified Randles circuit is used, in which R1 represents the resistance in the solid phase, which comes mainly from the parasitics of the connecting cables along with the probe’s internal resistance.
By performing user compensation with electrolyte in a known conductivity for calibration, the first term’s influence can be minimized. The latter can be done by connecting the four terminals as close as possible to the capacitor plates (DUT) instead of at the BNC breakout adapter.
The electrochemical double layer, which is formed at the solid-liquid interface, is at the middle of the circuit. It is key to observe that a non-ideal Warburg short (Ws) term is used in conjunction with a constant-phase element (CPE), which replaces typical double-layer capacitance often observed elsewhere (Ref 5).
This complex behavior is due to the fact that tap water contains multiple types of ions and even non-ionic species (Ref 6 and 7). The slope in the Bode plot slightly deviates from -1 at low frequency since the CPE does not reveal a perfect ‘-90 deg.’
The resistance and capacitance of tap water in the liquid phase are shown on the right side of the model (inset figure 4), where R2||C is the resistance. The -1 slope at high frequency correlates nicely to the capacitance.
The aim of this article is to study the conductance of liquid (tap water), which is why the focus remains on the middle frequency (100 – 10 kHz) region, which is where the resistance of the liquid phase (R2) dominates.
To simplify the complicated circuit, one can imagine that the impact from Ws and C is small, such that it can be simplified as R1+R2+CPE. Only a small shift in the phase is created by the CPE, which makes it slightly ‘capacitive’ (below zero) at around 1.4 kHz.
The conductivity probe, therefore, behaves similarly to a resistor. The fitted solution resistance R2, i.e., 3320 Ohm matches well with the measured impedance (at the lowest phase) of 3347 Ohm in Bode plot. The conductivity of tap water as 30 mS/m can be found using the equation above, agreeing with the reported range (ref 2).
Some conductivity probe manufacturers even specify a fixed frequency for simplicity (e.g., 1 kHz). This can be a good approximation as the impedance spectrum of tap water used here shows a broad flat region between 100 and 10 kHz.
However, such a simplification becomes invalid when the electrode-electrolyte interface (thanks to pronounced double-layer effect as in supercapacitors) or electrolyte itself (thanks to capacitive solutes such as cells) becomes more capacitive.
Instead, by performing circuit modeling from the measured impedance spectrum, one should carefully extract the electrolyte resistance. Clearly, this shows the benefit of sweeping over measurement at a fixed frequency.
Real-Time Impedance Monitoring
To finish, it’s important to examine the real-time impedance evolution. Using the ‘Plotter’ tool in LabOne, one of the five included APIs (C, LabView, Matlab, Python and .Net), the MFIA is able to record and stream the measured data.
The instrument’s data transfer rate can be set up to 107 KSa/s, which is significantly faster than Sa/s range as in typical conductivity probes. This process facilitates the observation of the fast-changing processes in the liquid.
Figure 5, as an example, illustrates how after adding a few NaCl salt grains into the measured tap water, the conductance increases to 970 μS (97 mS/m in conductivity, which is greater than the drinking water range, ref 2), and within 8 seconds the phase drops to -4.7 deg.
This supports the previous section’s claim section that impedance measurement at a fixed frequency is, therefore, less than ideal.
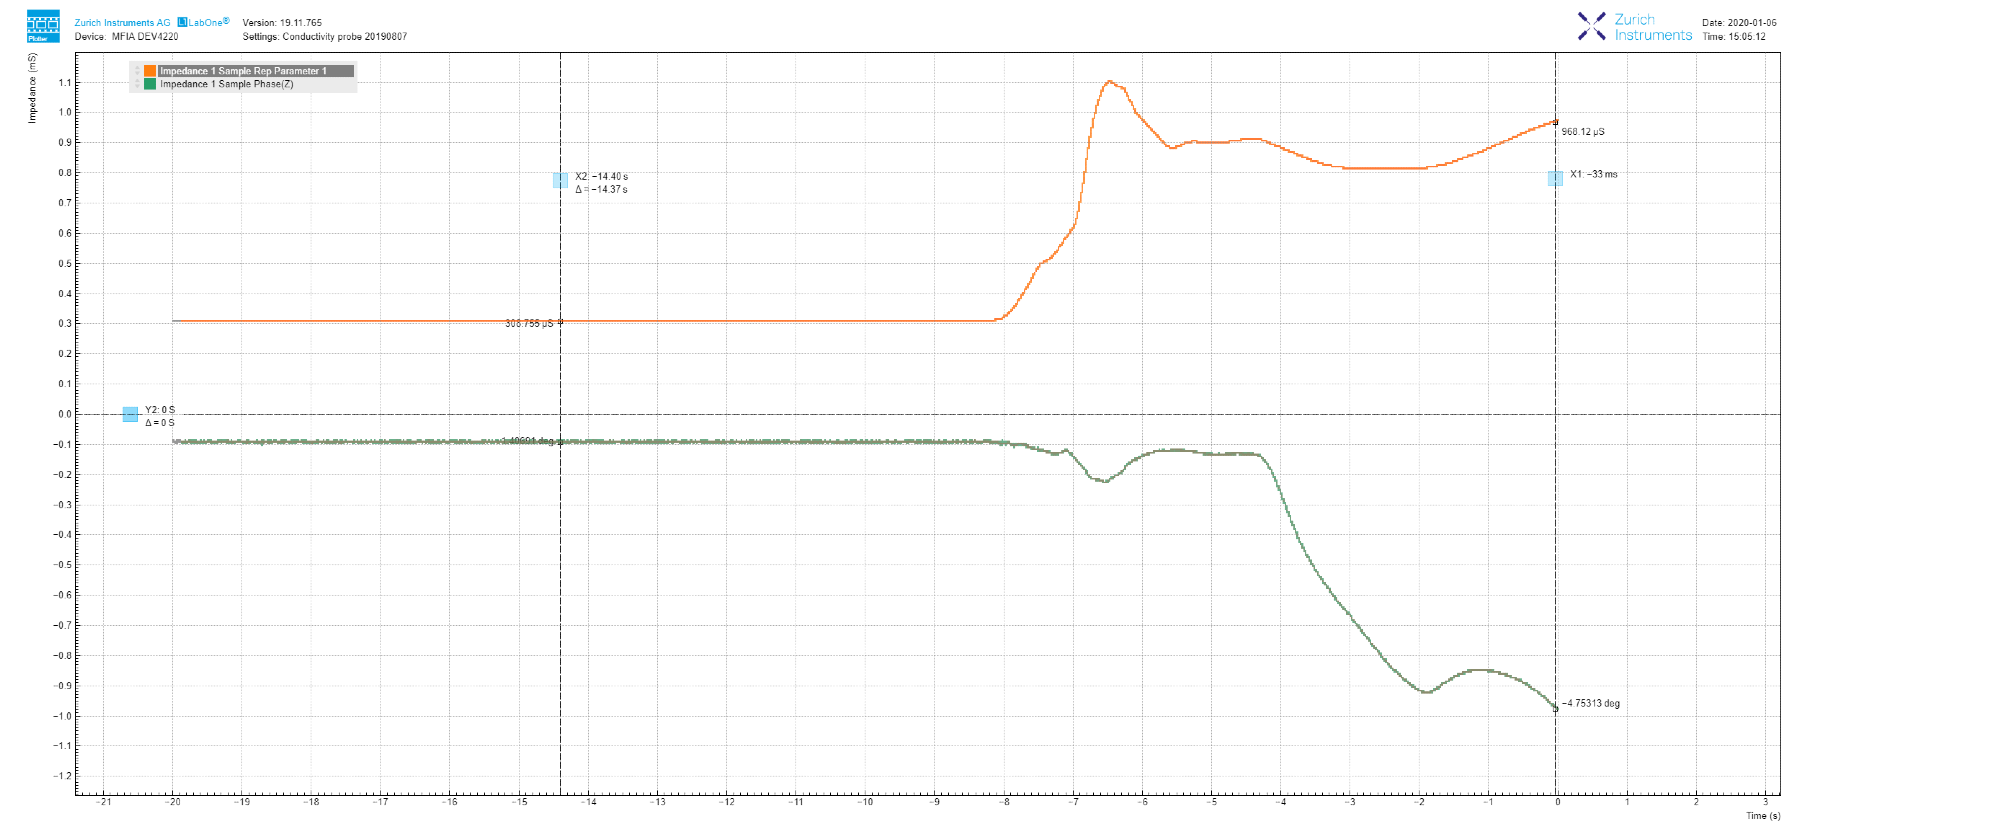
Figure 5. LabOne Plotter data showing the evolution of impedance measured at 1 kHz. The increase in conductance, as well as the decrease in phase, is caused by the addition of NaCl salt. Image Credit: Zurich Instruments
Conclusion
This application note explores how to set up the MFIA for measuring EIS in liquid over a large frequency range instead of at a sub-optimized fixed frequency. The MFIA can help to monitor fast processes in the time domain once the frequency of interest is determined.
This is therefore suitable to study the electrolyte performance for battery, supercapacitor, and microfluidic applications. Furthermore, the MFIA is also an excellent candidate for impedance-based sensor applications, thanks to its good accuracy and fast response.
References
- Bhat, S. (2005). Salinity (conductivity) sensor based on parallel plate capacitors. Graduate Theses and Dissertations. http://scholarcommons.usf.edu/etd/2784
- Wikipedia. https://en.wikipedia.org/wiki/Conductivity_(electrolytic)
- Li, M et al. (2018). Pseudocapacitive coating for effective capacitive deionization. ACS Applied Materials & Interfaces, 10(3), 2442-2450.
- Alem, M. Kramers–Kronig Test Applied to Impedance Measurements of Electrical Circuits. https://www.zhinst.com/ch/en/blogs/kramers-kronig-test-applied-impedance-measurements-electrical-circuits
- Bisquert, J et al. (2000). Doubling exponent models for the analysis of porous film electrodes by impedance. Relaxation of TiO2 nanoporous in aqueous solution. The Journal of Physical Chemistry B, 104(10), 2287-2298.
- Sammer, M et al. (2016). Strong Gradients in Weak Magnetic Fields Induce DOLLOP Formation in Tap Water. Water, 8(3), 79.
- Sammer, M et al. (2019). Biomass measurement of living Lumbriculus variegatus with impedance spectroscopy. Journal of Electrical Bioimpedance, 5(1), 92-98.
Note to get more reliable measurements over a long time (eg. extending the measurement frequency to 1 mHz), additional temperature and atmosphere control would be recommended.

This information has been sourced, reviewed and adapted from materials provided by Zurich Instruments.
For more information on this source, please visit Zurich Instruments.