With more than 2.5 million metric tons exported annually, one of the most widely traded food commodities is milk powder1. It is utilized in a wide variety of food products, from infant formula to confectionery and baked goods.
Unfortunately, with 137 cases of economically motivated adulteration worldwide recorded by the United States Pharmacopoeia in 2011-2012,2, dairy products are also a common target of food fraud.
The value of milk powder is to do with its protein content, and standard techniques for protein analysis are reliant upon a simple nitrogen assay, with the protein concentration inferred from the nitrogen content. It is, for this reason, the addition of chemicals rich in nitrogen can artificially increase the apparent protein, and so, the price demanded.
These known incidences of economically motivated adulteration have resulted in strict limits on melamine content. For instance, the U.S. FDA states that cyanuric acid or melamine should not be present in foods at levels of more than 2.5 ppm or 1 ppm for infant formula3.
Highly sensitive techniques like LC/MS/MS4 are required to determine the absence of these materials above these levels.
While it is crucial to have laboratory techniques with the highest sensitivity possible, such techniques are often expensive and time-consuming to perform, which may limit their ability to obtain representative samples.
There are also two additional concerns that are specific to economically motivated adulteration. The first is that ppm-level adulteration is not economically worthwhile, so genuinely adulterated samples will probably have higher concentrations.
For instance, it is necessary to add 2400 ppm of melamine to increase the total nitrogen in skim milk powder by 0.16 % (corresponding to an apparent protein increase of 1 % total mass).
Secondly, and more worryingly, while there are published cases of adulteration with melamine, "chemical space" is vast. There are many more high-nitrogen compounds that could potentially be utilized in the same way.5
It is vital to look beyond currently known adulterants and consider other possibilities to stay ahead of criminals. For these reasons, in the fight against economically motivated adulteration, "fingerprinting" tools that measure the entire sample's response without separation have a key role to play.
Near infrared (NIR) spectroscopy is already widely used in food, feed and agricultural industries for the quantitative analysis of nutritional and quality parameters like moisture, protein and fat.
What is less well known is that it can be a brilliant tool for verifying the integrity of ingredient samples in the face of potential adulteration. NIR spectra contain information about the whole sample – including any adulterants present, and they can be measured in seconds.
The spectra must be processed with appropriate chemometric tools to differentiate the contributions of the milk powder matrix and any adulterants as there is no physical separation process at work.
In this article, the utilization of the DairyGuard™ Milk Powder Analyzer and the novel Adulterant Screen™ algorithm is used to detect seven potential adulterants in milk powder at levels much less than 1 %, without any time-consuming PLS or other chemometric calibrations.
What is Adulterant Screen?
As seen in Figure 1, previous applications of NIR to adulterant detection have used standard chemometrics tools. Quantitative techniques which utilize PLS regression have been developed for melamine and have shown good performance.
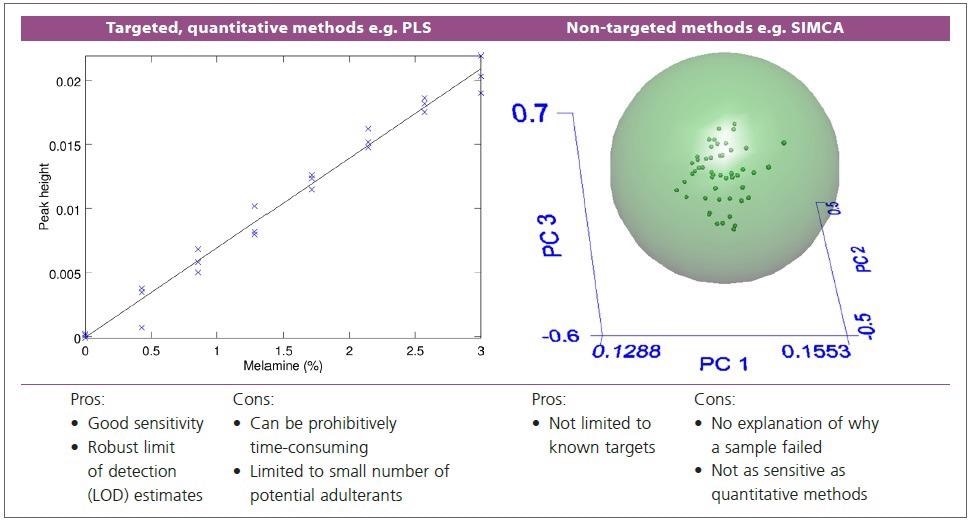
Figure 1. Schematic illustrations of existing chemometrics tools for adulterant analysis. Left: quantitative methods e.g. single peak height, or PLS regression. Right: non-targeted, factor-based methods e.g. SIMCA. Image Credit: PerkinElmer Food Safety and Quality
Yet, such targeted techniques are only applicable to the adulterants they are calibrated for, and the calibration can be an extremely time-consuming process, involving the preparation of dozens to hundreds of samples with precisely known concentrations of the adulterant.
Utilizing a principal components analysis (PCA)-based technique like SIMCA is an alternative approach in which a model is built for the unadulterated material, and the quality of match of the sample spectrum to this model is employed to establish whether the result is a pass or a fail.
There is no indication of why a failing sample has failed (no identification of the adulterant) even though this method is truly non-targeted and potentially sensitive to any adulterant because the technique makes no use of the adulterant spectrum, so the sensitivity cannot be expected to be as high as for a quantitative approach.
Lastly, techniques that rely on conventional library searching, even with multivariate algorithms, suffer from an inability to model the variation accurately in the matrix and are frequently utilized with commercial libraries, which may be of limited applicability
Adulterant Screen is a new algorithm that is specifically designed to address the problem of screening a complex matrix for potentially multiple adulterants. It combines the simplicity and generality of non-targeted screening with some of the sensitivity advantages of a targeted approach.
How Does it Work?
Exactly as for SIMCA, the first step is to produce a library of spectra of samples of the unadulterated material. This library should span as much as possible of the natural variation of the material – because of differences between suppliers, batches or processing parameters, for example.
Yet, these are all "normal" samples, so there is no need to collect "high-leverage" samples (e.g., those with unusual nutritional parameters), as is usually the case for quantitative techniques used for nutritional properties.
A typical library for milk powder might contain a few dozen samples, but the amount of spectra needed depends on the complexity of the matrix and the desired sensitivity. The second step is to prepare a library of adulterant spectra.
There is no need to create mixtures as these are spectra of the pure adulterants. This has already been done with DairyGuard, a spectral library of 19 high-nitrogen industrial and agricultural chemicals is included with the system.
Adding a new adulterant to the library is as simple as measuring the pure adulterant, and then copying the spectrum to the library folder. These two sets of spectra are registered in the software, so the technique is ready to use.
Performance Compared with SIMCA: Physically Spiked Samples
Sixty-six samples of whole milk powder were prepared by spray-drying: six were used as blank controls, twelve were used to prepare contaminated samples, and forty-eight were utilized for the material library.
The following potential adulterants were used:
- Melamine
- Cyromazine
- Urea
- Dicyandiamide
- Cyanuric acid
- Biuret
Each compound was finely ground then mixed thoroughly with the milk powder at concentrations of 0.2 % and 2 % mass.
Samples prepared in a different way (e.g., "wet blending") may yield different results and require modified library spectra. Spectra were quantified on a PerkinElmer DairyGuard Milk Powder Analyzer, which consists of a FrontierTM near-infrared (NIR) spectrometer utilizing a NIRA II diffuse reflectance accessory.
A resolution of 16 cm-1 was used at an accumulation time of 20 s per sample. A SIMCA technique was built by utilizing PerkinElmer AssureID™ software at the default confidence level (99 %). All 48 spectra from the material library were employed.
Adulterant Screen was configured with 24 of the spectra for validation (threshold setting) and 24 for calibration. Table 1 shows a summary of the results, demonstrating that Adulterant Screen supplies much better sensitivity than SIMCA.
Table 1. Performance of SIMCA (with 99% confidence level) and Adulterant Screen for physically spiked whole milk powder samples. DCD = dicyandiamide; AS = Adulterant Screen. Incorrect results (false negatives) are highlighted. See the sidebar on prior page for an explanation of the de tection limit and confidence estimates. Source: PerkinElmer Food Safety and Quality
| Sample |
SIMCA
pass? |
AS
pass? |
AS level
(%) |
AS det. limit
(%) |
AS
confidence |
| Blanks 1-6 |
Yes |
Yes |
Below LOD |
- |
- |
| Adulterants at 2% |
No |
No |
All adulterants correctly identified |
| Biuret 0.2% |
Yes |
No |
0.19 |
0.15 |
Possible |
| Cyanuric acid 0.6% |
Yes |
No |
0.37 |
0.25 |
Likely |
| Cyromazine 0.2% |
Yes |
Yes |
0.017 |
0.11 |
Unlikely |
| DCD 0.2% |
Yes |
Yes |
0.019 |
0.095 |
Very unlikely |
| Melamine 0.2% |
No |
No |
0.21 |
0.12 |
Likely |
| Urea 0.2% |
No |
No |
0.14 |
0.07 |
Likely |
The Adulterant Screen Algorithm
When a sample spectrum is scanned, the algorithm first compares it to a PCA model produced from the reference materials. Next, this model is augmented with each of the adulterant spectra in turn.
It is likely that the adulterant is present in the sample if including a given adulterant in the model greatly increases the fit of the sample spectrum. The algorithm also searches for every combination of up to three potential adulterants to account for contamination with multiple adulterants.
For each adulterant in the library, the output of the algorithm is an estimated detection limit, concentration and confidence indicator.
The concentration estimate is based on the relative intensity of the library spectrum of the adulterant and the amount determined in the sample spectrum, without considering effective pathlength differences.
So, it is a semi-quantitative estimate, and the detection limit estimate is expressed in the same way. Lastly, the reported confidence indicates the likelihood that the adulterant is present.
As the sensitivity of the technique is dependent on the similarity between the adulterant spectrum and the material spectrum, the detection limit estimate and confidence indicator are vital.
To validate the detection limits, it is recommended to prepare a small number of samples with concentrations that are slightly higher than the estimated detection limits and verify that the adulterants are detected with high confidence.
The software will warn the user that unidentified components may be present if the milk powder itself is a poor match to the original calibration data or if the sample is contaminated with a species that is not present in the library.
Both techniques correctly recognized the blank samples as uncontaminated. SIMCA had no difficulty detecting adulteration at the percent level, and 0.2% was enough to trigger a failure in some instances (melamine and urea).
Adulterant Screen fared better in terms of sensitivity, detecting biuret at 0.2 % and cyanuric acid at 0.6 % (but not cyromazine or DCD at 0.2 %). Adulterant Screen also supplied correct identifications for the adulterants in addition to the improved sensitivity, whilst SIMCA merely indicated a pass or fail, without any indication as to why.
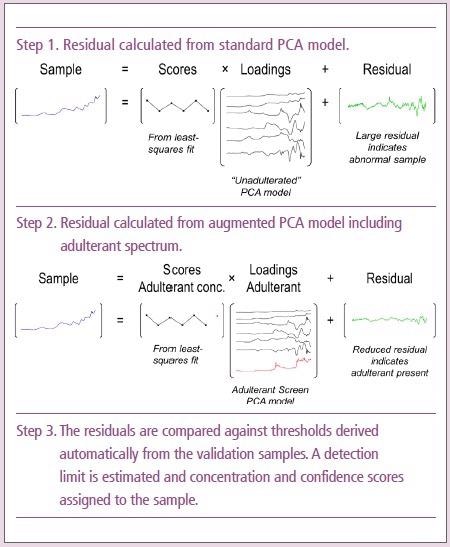
Image Credit: PerkinElmer Food Safety and Quality
Enhanced Diagnostics
SpectrumTM software supplies a range of diagnostic tools for advanced users; Figure 2 shows an Adulterant Screen results screen. It should be noted that, while adulterants are listed for the blanks, the levels and confidence values are very low.
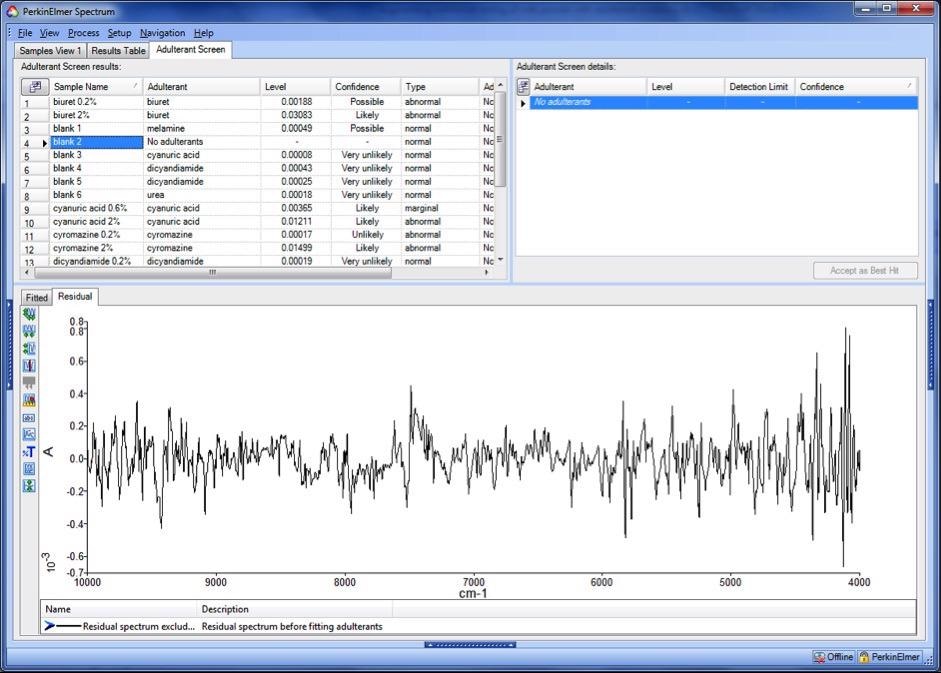
Figure 2. Typical results screen for Adulterant Screen in Spectrum Software version 10, showing the residual spectrum for an uncontaminated sample. Image Credit: PerkinElmer Food Safety and Quality
The residual spectrum for one of the blank samples is shown, and there is no evidence of any structure which may be associated with an unmodeled component.
In comparison, the residuals from a contaminated sample (2 % urea) exhibit considerable structure (red trace in Figure 3). Most of this structure is eliminated (green trace) when the adulterant spectrum is included in the fit.
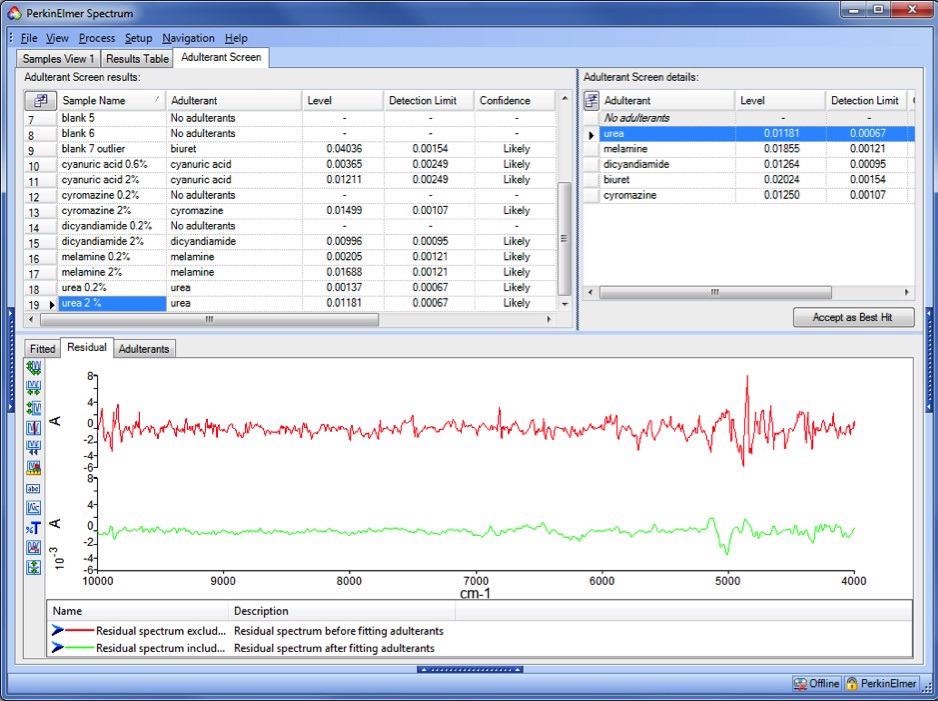
Figure 3. Residual spectra for a contaminated sample. Red trace: PCA residual, showing evidence of unmodeled components. Green trace: Adulterant Screen residual, showing a much improved fit. Image Credit: PerkinElmer Food Safety and Quality
It is generally not true that the structure will be recognizable as the spectrum of the adulterant even if the structure in the residual is a result of the presence of an adulterant. There will usually be both negative and positive spectral features in positions corresponding to absorption bands of both the adulterant and the uncontaminated material (milk powder).
Adulterant Screen estimates the spectrum of the adulterant from the sample spectrum to provide a more interpretable spectrum. It utilizes a least-squares fit to both the adulterant reference spectrum and the uncontaminated material.
Good agreement between the library spectrum and the extracted adulterant spectrum is a strong indicator that the adulterant is present, particularly for chemical adulterants with distinctive spectra.
Conversely, if bands from the library spectrum are missing in the extracted spectrum, this may indicate that the sample is adulterated with something which cannot be found in the library.
The extracted (black) and library (red) spectra for the 2 % urea sample are shown in Figure 4. Every peak in the library spectrum is matched by a peak in the estimated spectrum, so the user can be confident that urea is present in the sample.
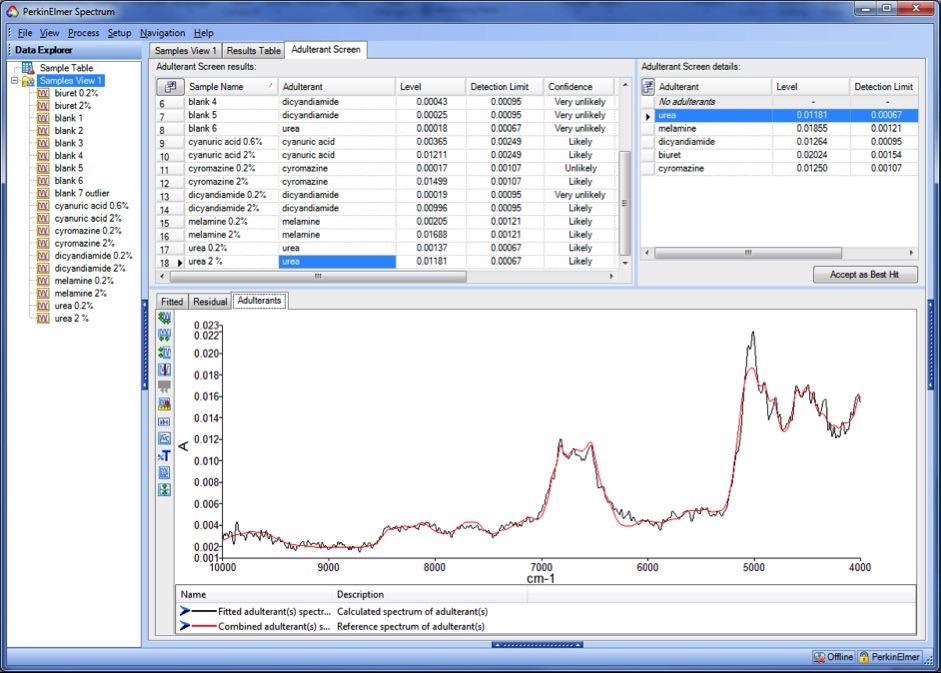
Figure 4. Estimated (black trace) and library (red trace) adulterant spectra for a sample contaminated with 2% urea. Image Credit: PerkinElmer Food Safety and Quality
When investigating results at or near the detection limit, as in the instance of a sample contaminated with 0.2 % melamine, as seen in Figure 5, this mode of results visualization is particularly useful.
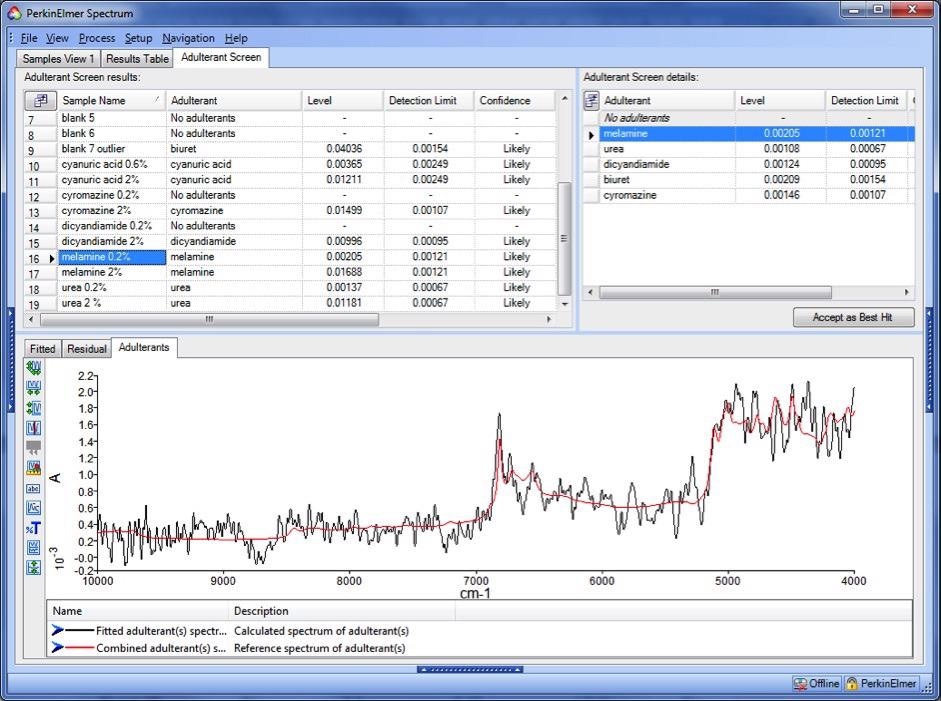
Figure 5. Estimated (black trace) and library (red trace) adulterant spectra for a sample contaminated with 0.2% melamine. Image Credit: PerkinElmer Food Safety and Quality
Although this sample triggered a "fail" result for both Adulterant Screen and SIMCA, indicating a requirement for further analysis, the Adulterant Screen result strongly indicates that melamine may be present, supplying significantly more information to guide the next steps.
Comparison with SIMCA: Synthetically Spiked Samples
The sensitivity of SIMCA and Adulterant Screen was investigated further by utilizing synthetically spiked spectra that were created by adding between 0.1 % and 2.0 % of each adulterant spectrum to one of the blank spectra.
Since the effective pathlength for the adulterant is dependent on the measurement matrix (i.e., either the adulterant itself or the milk powder), the spectra generated are not equivalent to spectra of physically spiked samples, but they do enable a comparison of the relative sensitivities of the two techniques.
Adulterant Screen clearly provides significantly better performance. This is because Adulterant Screen is actively searching for structure corresponding to the spectra of identified adulterant threats, while SIMCA only considers the magnitude of the residuals.
Adulterant Screen consistently outperformed SIMCA for the detection of contaminated samples, while the difference in performance on the physically spiked samples was not as dramatic.
Table 2. Performance of Adulterant Screen compared with SIMCA (at the indicated confidence le vel) for synthetically spiked samples. Source: PerkinElmer Food Safety and Quality
| Adulterant |
Lowest Detected Concentration (Synthetic Spiking) |
| SIMCA (99%) |
SIMCA (95%) |
Adulterant Screen |
| Biuret |
>2% |
>2% |
0.2% |
| Cyanuric acid |
>2% |
>2% |
0.3% |
| Cyromazine |
0.6% |
0.5% |
0.3% |
| Dicyandiamide |
1.4% |
1.2% |
0.3% |
| Melamine |
0.7% |
0.6% |
0.3% |
| Urea |
1.7% |
1.4% |
0.3% |
Integration Within a Complete Workflow
Pass/fail criteria, which consider both confidence and level (concentration), can be set; this allows Adulterant Screen to be employed as part of a routine incoming-material test.
The process can be incorporated as part of a Spectrum Touch™ App, allowing simple, reliable operation by non-specialist users.
The DairyGuard Milk Powder Analyzer system includes the Spectrum Touch App seen in Figure 6, containing SIMCA and Adulterant Screen analyses in addition to example quantitative techniques, which can be utilized as a starting point for developing your own apps.
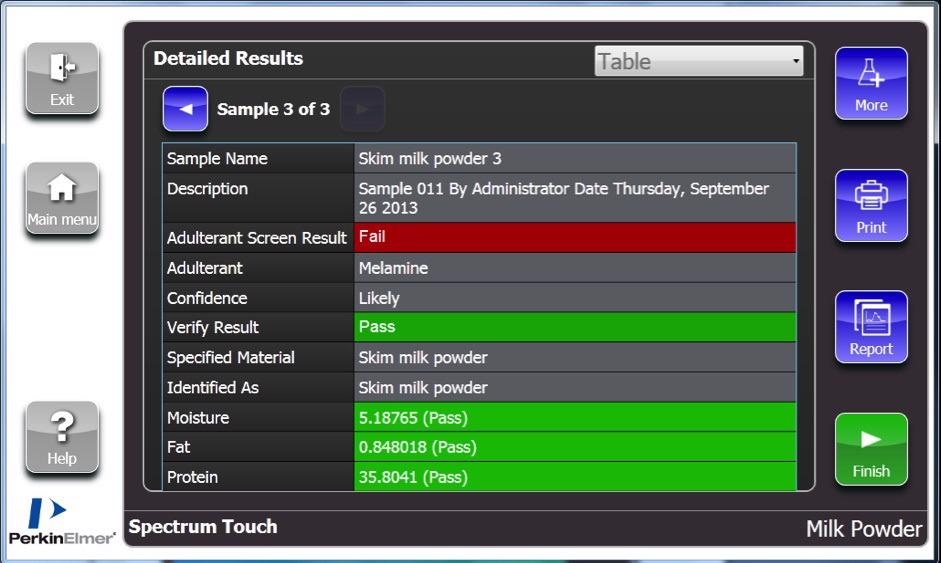
Figure 6. Results screen for the DairyGuard Touch App, showing a sample that has passed the Certificate of Analysis (COA confirmation tests and the SIMCA non-targeted screen, but failed on the more sensitive Adulterant Screen due to a low concentration of melamine. Image Credit: PerkinElmer Food Safety and Quality
Summary
Adulteration of food and food ingredients for economic gain is an old practice and, sadly, one that is unlikely to be eliminated in the near future. This problem must be addressed with all the analytical methods possible: given its ubiquity in raw materials testing, NIR spectroscopy clearly has a role to play.
The unique Adulterant Screen algorithm from PerkinElmer retains the strengths of non-targeted chemometric techniques, such as SIMCA, but attains higher sensitivity by using a library of spectra of potential adulterants.
The technique can be easily adapted to screen new products or for new adulterants without having to prepare mixture samples for calibration.
The utilization of an adulterant library also enables much richer diagnostic information to be generated, providing much greater confidence in the results and informing the next analytical steps to take for a suspect sample.
The PerkinElmer DairyGuard Milk Powder Analyzer is a complete solution pre-configured for Adulterant Screen analysis of milk powders (together with the standard quantitative analyses), with all the features integrated into a simple, touchscreen-based interface.
References
- United States Department of Agriculture Foreign Agricultural Service. Dairy: World Markets and Trade. 25 July 2011.
- United States Pharmacopoeia. Food Fraud Database. Web address: http://www.foodfraud.org (accessed November 2013).
- United States Food and Drug Administration. Press release: FDA Issues Interim Safety and Risk Assessment of Melamine and Melamine-related Compounds in Food. October 3, 2008. Web address: https://www.fda.gov/ (accessed November 2013).
- Sherri Turnipseed, Christine Casey, Cristina Nochetto, David N. Heller. Determination of Melamine and Cyanuric Acid Residues in Infant Formula using LC-MS/MS. US FDA Laboratory Information Bulletin 4421, October 2008.
- Shaun MacMahon, Timothy H. Begley, Gregory W. Diachenko, Selen A. Stromgren. A liquid chromatography–tandem mass spectrometry method for the detection of economically motivated adulteration in protein-containing foods. Journal of Chromatography A, 1220 (2012), 101-107.

This information has been sourced, reviewed and adapted from materials provided by PerkinElmer Food Safety and Quality.
For more information on this source, please visit PerkinElmer Food Safety and Quality.