Delta Instruments BV, a subsidiary of Advanced Instruments, Inc., is thrilled to declare the introduction of the high-speed, routine determination of NPN/Calculated urea in raw milk for Delta Instruments FTIR milk analyzers.
It is well-established that concentrations of non-protein nitrogen (NPN) and urea in fresh milk are closely related, and on average, NPN represents about 45% of urea.
Analysis of NPN/Calculated urea in raw milk is a useful indicator of how effectively cows digest protein in the rumen. This, in turn, offers crucial information for the control of feeding strategies and reproductive performances.
With the NPN/Calculated urea analysis results, ration content or sequence can be adjusted to improve milk production, body score and reproductive performance. This will also enhance the production of milk for cheese, reduce environmental nitrogen waste and improve feeding costs.
This robust calibration model functions effectively on all Delta Instruments, such as the LactoScope FTIR or CombiScope FTIR milk analyzers. The operational heart of the LactoScope FTIR is the patented FTIR spectrometer. The Wish Bone construction is pre-aligned, which provides benefits, including high reliability and calibration transferability.
Benefits of NPN/Calculated Urea Measurement
- Time savings: high-speed routine monitoring of NPN/calculated urea with speeds that yield up to 400 samples per hour.
- Cost savings: Delta Instruments provides the robust and reliable NPN/Calculated urea calibration model free of charge with any new FTIR analyzer*.
- Low cost per sample: No additional consumables or instrumentation are required
* Upon request of the end-user.
Specifications
Table 1. Source: PerkinElmer Food Safety and Quality
| |
Accuracy Sd |
SEP# |
| Accuracy Individual Cow Milk |
< 4 mg urea/dL |
3.6 mg urea/dL |
| Accuracy Bulk Tank Milk |
< 3 mg/dL |
2.0 mg urea/dL |
Repeatability |
<1.5 mg urea/dL |
|
| Analytical range |
10-100 mg/dL |
|
* Results of validation studies with a total set of 330 samples.
The Non-Protein Nitrogen (NPN) of raw milk corresponds closely with the urea content of both herd milk (figure 1) and individual cow milk (figure 2).1,2,3,4,5
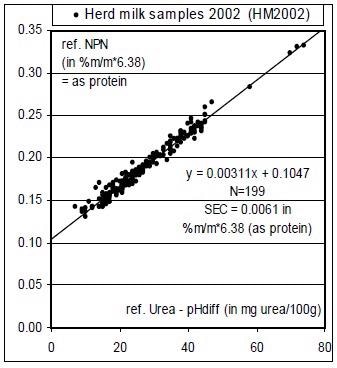
Figure 1. Image Credit: PerkinElmer Food Safety and Quality
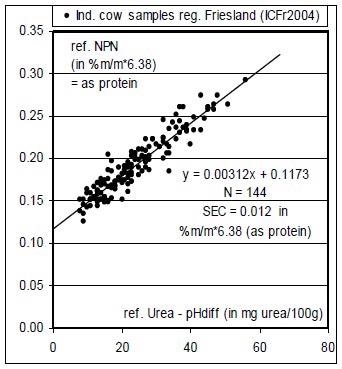
Figure 2. Image Credit: PerkinElmer Food Safety and Quality
Quantifying the NPN content of a fresh milk sample in the Mid Infrared (ref.6) facilitates calculations of the urea content using a univariate relationship of the form NPN = a * Urea + b where a and b are constants and b is the non-urea fraction of NPN.
The results of Delta Instruments’ study for IR calibration model for NPN demonstrate that it can anticipate the urea content of herd milk with a SEP of +/- 2 mg urea/dL (figure 3) and a SEP between 3 to 4 mg urea/dL for individual cow milk (Figure 4) while sustaining a repeatability standard deviation below 1.5 mg urea/dL.
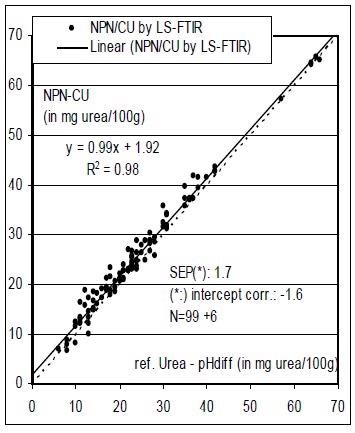
Figure 3. Image Credit: PerkinElmer Food Safety and Quality
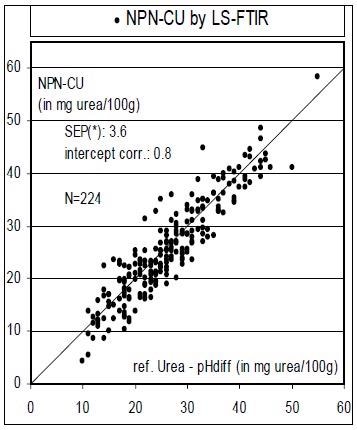
Figure 4. Image Credit: PerkinElmer Food Safety and Quality
The results above contrast the urea content of samples as calculated from the NPN determination (NPN/CU) to urea as identified using the reference method (ISO14637/IDF195)
References
- Roseler D. K., The effect of dietary protein degradability and undegradibility on milk urea nitrogen, milk NPN, and blood urea nitrogen in lactating dairy cows (1990) Thesis – Cornell University.
- DePeters E.J. & Ferguson J.D., Nonprotein Nitrogen and protein distribution in the milk of cows (1992) J. Dairy Sci, 75, 3192-3209.
- Roseler D. K., Ferguson J.D., Sniffen C.J. & Herrema J., Dietary protein degradability effects on plasma and milk urea nitrogen and milk non-protein nitrogen in Holstein cows (1993) J. Dairy Sci, 76, 525-534.
- Baker L.D., Ferguson J.D. & Chalupa W., Responses in urea and true protein of milk to different protein feeding schemes for dairy cows.
- Wolfschoon-Pombo A. & Klostermeyer H., Die NPN-Fraction der Kuhmilch – 1. Menge und Zusammensetzung (1981) Milchwissenschaft, 36, 598-600.
- Kennedy J.F. & White C. A., Application of infrared reflectance spectroscopy to the analysis of milk and dairy products (1985) Food Chemistry, 16, 115-131.

This information has been sourced, reviewed and adapted from materials provided by PerkinElmer Food Safety and Quality.
For more information on this source, please visit PerkinElmer Food Safety and Quality.