Sponsored by PerkinElmerReviewed by Olivia FrostJun 19 2024
A vital parameter in pharmaceutical samples is loss on drying, which is utilized to determine the amount of water and other volatile solvents in a sample, as it can impact a product's stability, longevity, and processing characteristics.
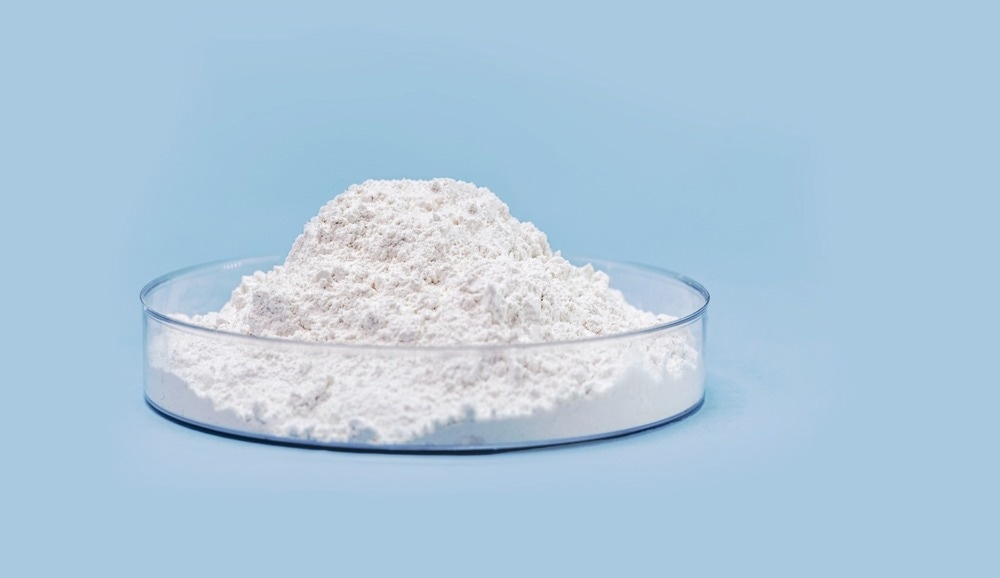
In this study, the PerkinElmer Pyris™ TGA 9 is used to quantify the loss on drying of a microcrystalline cellulose sample, a common excipient in the pharmaceutical industry.

Image Credit: Shutterstock/RHJPhotos
This study also highlights the ability of the TGA 9 to function at sub-ambient temperatures with no need for added cooling accessories besides a water circulator. Starting the analysis at a less-than-ambient temperature is critical in loss on drying experiments as this helps to prevent the loss of volatiles before the measurement even begins.
This study will demonstrate how the PerkinElmer Pyris TGA 9, paired with Pyris™ software, offers an easy-to-use, powerful solution for measuring the loss on drying to quantify moisture content with accuracy.
Experimental
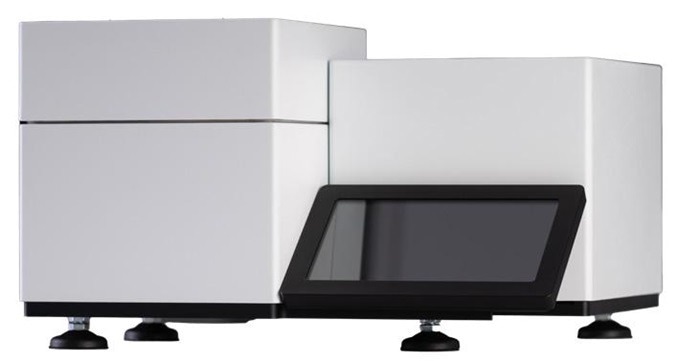
For each run, a 10 mg (+/- 1 mg) sample of microcrystalline cellulose with a known moisture content of approximately 5 % was measured as received without additional sample treatment or preparation. The samples were measured in ceramic crucibles (N5200040) in the PerkinElmer Pyris TGA 9 thermogravimetric analyzer (Figure 1).
The first method heated the sample from a starting temperature of 13 °C up to 180 °C at a temperature ramp rate of 5 °C/minute.
Subsequent analyses maintained the same ending temperature and ramp rate but varied the starting temperatures. This approach was used to highlight the significance of initiating loss on drying experiments below ambient temperature.

Figure 1. PerkinElmer Pyris™ TGA 9 Thermogravimetric Analyzer. Image Credit: PerkinElmer
Results
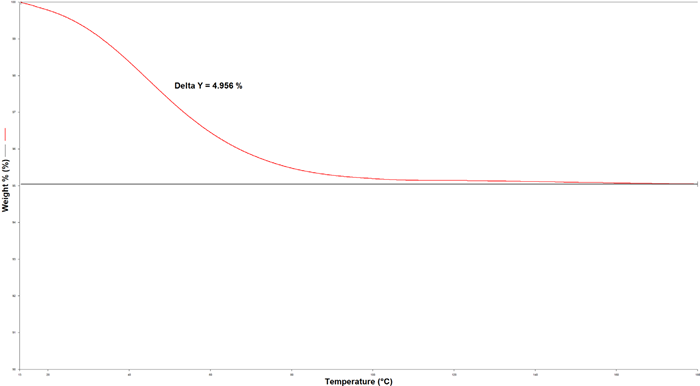
The thermogram produced using the specified temperature program is displayed in Figure 2. By employing the 'delta Y' function in PerkinElmer's Pyris software, the loss on drying is easily quantified.
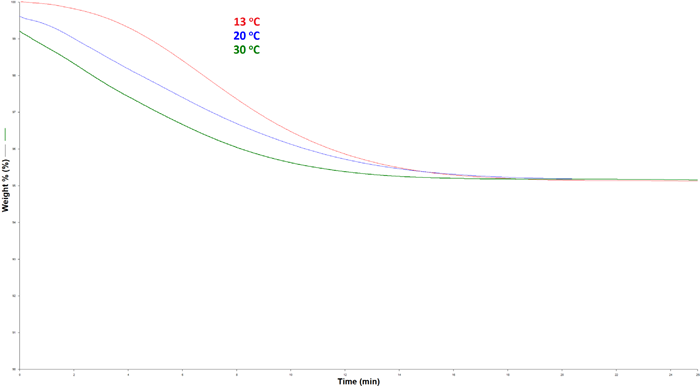
In this experiment, loss on drying was noted to be 4.96 %. To examine the impact of a range of starting temperatures, the same program was applied but using starting temperatures of 20 and 30 °C. Those results and the original data are noted in Figure 3.

Figure 2. Thermogram acquired during a loss on drying test starting at 13 °C. Image Credit: PerkinElmer

Figure 3. Loss on drying weight loss curves for temperature programs starting at 13, 20, 30, and 50 °C. Image Credit: PerkinElmer
Table 1 shows the loss on drying results for each starting temperature. The data indicates that starting temperature can have a huge impact on the final loss of drying result. The weight loss value for the run with starting temperatures at 30 °C was approximately 1 % lower than anticipated.
Summary
The PerkinElmer Pyris TGA 9 is equipped with superior sub-ambient capabilities, even when using a standard cooling accessory like a water circulator. This feature enables rapid and precise determination of loss on drying for pharmaceutical products, as well as other materials, including fine chemicals and foodstuffs.
Table 1. Loss on Drying Results for Temperature Programmes starting at different temperatures. Source: PerkinElmer
| Starting Temperature (°C) |
Loss on Drying (%) |
| 13 |
4.96 |
| 20 |
4.45 |
| 30 |
4.06 |
By beginning the analysis at 13 °C, evaporation under the dry nitrogen purge is minimized, ensuring measurement accuracy. Pyris software provides a range of tools that enable users to streamline data analysis and determine an assortment of different vital sample characteristics with ease.

This information has been sourced, reviewed and adapted from materials provided by PerkinElmer.
For more information on this source, please visit PerkinElmer.