Sponsored by MicrotracReviewed by Emily MageeNov 25 2022
This article looks at how Dynamic Image Analysis (DIA) and Laser Diffraction (LD) technologies may be used to characterize the size and shape of common metal powders and metal alloys, utilizing the Microtrac MRB CAMSIZER X2 and SYNC analyzers. These instruments offer rapid analytical durations, great repeatability, and “infinite” resolution.
Several distinct size and shape parameters are measured and recorded for each particle, and all data is available straight after the measurement is completed. Shape parameters are presented on a scale of 0 to 1 as ratios of various size measurements. Each parameter’s data can be displayed in frequency and cumulative distributions, as well as volume and number formats. The entire parameter data set can be presented for every particle.
Image Analysis
Image analysis techniques offer a straightforward solution to particle size analysis. The basic principle is: “What you see is what you get”. Automatic software algorithms determine particle size and morphology based on digital images of individual particles.
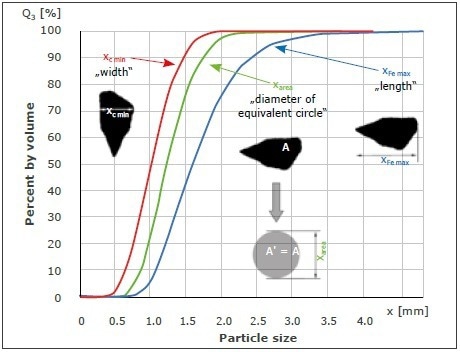
Figure 1. Selection of CAMSIZER X2 basic size parameters used in image analysis. The size distributions are based on width (red), length (blue), or equal area diameter (green). Image Credit: Microtrac MRB
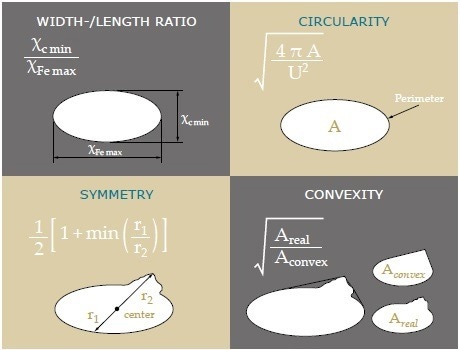
Figure 2. Selection of basic shape parameters (CAMSIZER X2). Image Credit: Microtrac MRB
The CAMSIZER X2: DIA Analyzer
The CAMSIZER X2, which has the industry’s broadest dynamic range of 0.8 µm to 8 mm, measures suspensions and dry samples by employing one of three distinct sample dispersion accessories. Figure 1 shows particle length, width, and equivalent area diameter data from the CAMSIZER X2. Figure 2 depicts a variety of shape parameters.
Particles move in front of a camera system in the CAMSIZER X2 (DIA) measurement setup, either conveyed by single-pass air flow or recirculating in liquid. As a result, data from millions of particles can be obtained in minutes, particularly when measuring dry. The results are statistically sound as they are based on a representative sample material for both techniques.
Figure 3 depicts the primary optics configuration for the CAMSIZER X2 Dynamic Image Analyzer. A light source lights the particles from one way while a camera system takes images from the opposite side as they travel across the field of view. With a high acquisition rate, the software assesses the particle's shadow projections to estimate the sample's size distribution.
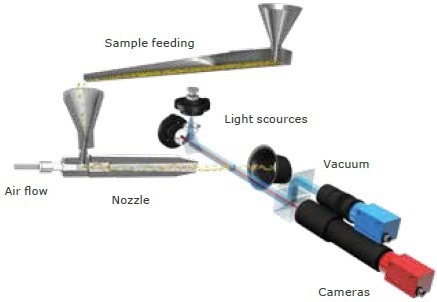
Figure 3. Unique measurement principle of CAMSIZER X2 for analysis of dry powders. Image Credit: Microtrac MRB
The dual camera technology of the CAMSIZER X2 is a unique feature, with two cameras with various magnifications covering a large measuring range. A high magnification camera is specialized for small particle analysis, while a second camera with a lower magnification but a wide field of view enables simultaneous analysis of larger particles with excellent detection efficiency.
The CAMSIZER X2 records approximately 300 frames per second, with each frame holding hundreds of particles depending on the sample size range.
The particle size distribution and quantitative particle shape are measured by DIA (percentage of round versus irregularly shaped particles, agglomerates, etc.). Very minute levels of large, undersized, or irregularly shaped particles, as low as 0.002%, can be detected.
DIA provides the user with a complete and in-depth understanding of sample attributes relating to size and morphology. Because it is precise, robust, sensitive, and simple to use, DIA is perfect for R&D applications and quality control.
Wide Range of Materials, Particle Sizes, and Particle Shapes
A selection of application cases is provided below to highlight the usefulness of DIA for comprehensively characterizing metal particles. Figure 4 depicts the size analysis results of ten distinct metal powders commonly used in powder metallurgical applications. All samples, regardless of chemistry, density, size, or shape, can be studied using the CAMSIZER X2 with a single instrument setup.
The sample is transported to the analyzer by an automatic feeding chute. The airflow then collects the particles. In this situation, 50 kPa was sufficient for complete dispersion, i.e., particle separation.
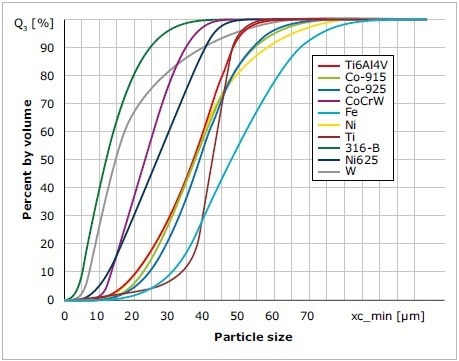
Figure 4. Particle size analysis of ten different metal powders with the CAMSIZER X2. The direct measurement ensures accurate results. Image Credit: Microtrac MRB
The samples exhibit a range of mean particle sizes between 10 and 50 µm, with varying distribution widths (Figure 4). The iron powder (Fe) is the coarsest in this specimen, while the steel powder (316) is the finest. Titanium powder has an extremely narrow size distribution.
According to the shape diagram (Figure 5), the iron powder has the smallest aspect ratio (breadth/length), but the titanium powder has the highest proportion of spherical particles.
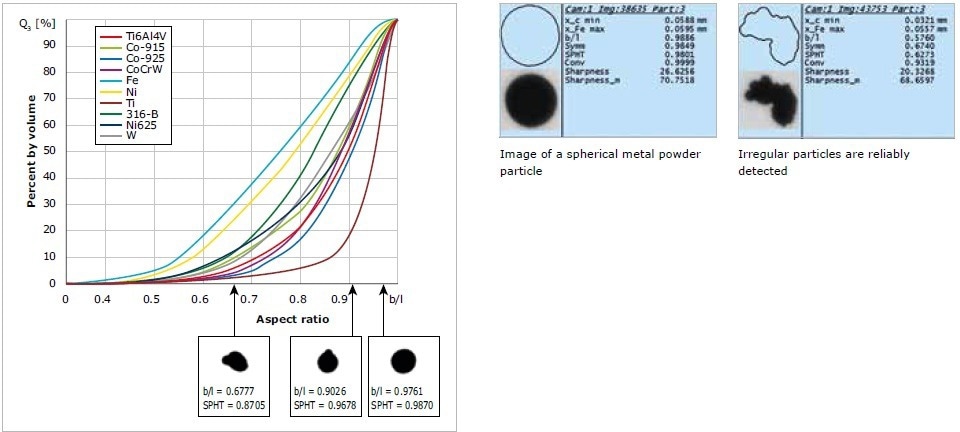
Figure 5. Analysis of particle shape of 10 different metal powders with Dynamic Image Analysis (CAMSIZER X2). Beside the quantitative results, the recorded images allow an intuitive understanding of morphology and size differences. More spherical particles with higher aspect ratio plot on the right side of the diagram. Detecting the smallest amounts of irregular particles in a large quantity of predominantly spherical particles is a great advantage of DIA. Image Credit: Microtrac MRB
Powder metallurgical processes often demand a wide particle size distribution to facilitate powder packing into the die by filling the void areas between large particles with smaller ones. An uneven shape is generally advantageous for sintering because it promotes particle interaction.
The particles should not be too irregular, as this will make compaction more challenging. A spherical shape with a wide size distribution provides a smooth powder coating to ensure appropriate sintering and effective metal products in additive manufacturing. Because the average particle size is between 10–50 µm, the titanium powder in the preceding example is appropriate for additive manufacturing.
Oversized or highly irregular particles must be recognized with extreme precision since they are likely to cause problems in the finished workpiece. DIA consistently detects even modest amounts of these unwanted particles. Figure 6 demonstrates how easily DIA can discover faulty particles.
The SYNC: Hybrid DIA and Laser Diffraction (LD) Analyzer
The innovative SYNC analyzer is a ground-breaking hybrid instrument that combines LD and DIA technologies in one unit, analyzing the sample in the same sample cell simultaneously. For decades, metal powder industries have used LD (a type of light scattering technology) produced by metal powder suppliers as the de facto standard for evaluating size distributions in outgoing quality control (QC) certification. They have also used equipment developed by powder metallurgy parts producers for incoming QC verification.
Figure 6 depicts the SYNC’s optical bench. Three lasers, accessible in blue or red, combined with two linear diode detector arrays, gather scattered light from passing particles over a 163-degree range. Smaller particles scatter light at greater angles and lower intensity than larger particles.
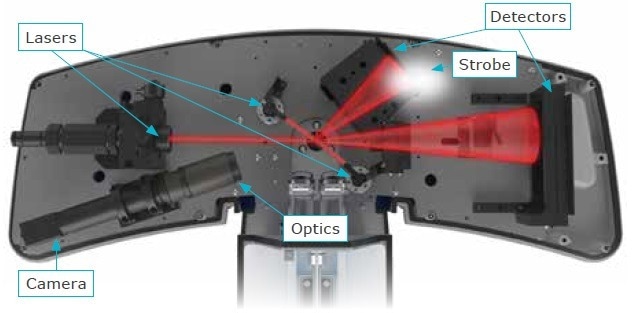
Figure 6. Layout of the SYNC optical bench, combined LD and DIA components. Image Credit: Microtrac MRB
The SYNC algorithm for LD estimates the particle size distribution that produces the measured light flux distribution. The algorithm accounts for non-spherical and translucent particles by employing a modified Mie theory.
Simultaneously, a quick LED strobe lamp lights the particles, and a set of optics focuses the transmitted light for a digital camera to photograph the entire video file of the particle images, similar to how the CAMSIZER X2 does, except that the SYNC only utilizes one camera.
The illustration depicted in Figure 7 is the LD size distribution report used by the metal powders industries.
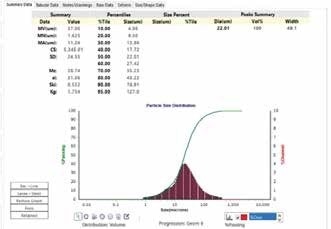
Figure 7. LD particle size report from SYNC, including percentiles, summary statistics data and frequency/cumulative distribution graphs. Image Credit: Microtrac MRB
The DIA post-measurement software includes a Particle Viewer and Scatter Diagram displays. These can be used to determine and quantify the agglomeration percentage in a metal powder batch. This enables metal powder suppliers to recycle a defective batch (too many agglomerates) before shipping it to a consumer. This enables parts producers to reject a faulty incoming batch and save time and money during processing.
Using two shape parameters, both the CAMSIZER X2 and the SYNC successfully quantify agglomerates in a metal powder sample. Because these agglomerates appear throughout the size distribution, size cannot be utilized. The shape parameters include one that evaluates the aspect ratio and another that assesses how convex the outside boundary is.
An example using the SYNC is detailed here. The width to length aspect ratio (W/L Aspect Ratio) and solidity will be used as criteria. A particle with a solidity of 1 has an outside boundary that is fully convex with no concave indentations. A perfect sphere would be a particle with a W/L Aspect Ratio of 1. Convexity (Conv) and breadth divided by length (b/l) are the parameters of the CAMSIZER X2.
The SYNC software’s Search tool was utilized to isolate and analyze the agglomerates, including all particles outside of the red area in Figure 8. The agglomerates made up approximately 23% of the whole sample by volume and 12% by number. This is critical quality control information for the metal powder and parts industries.

Figure 8. Analysis of particle shape of 10 different metal powders with Dynamic Image Analysis (CAMSIZER X2). Beside the quantitative results, the recorded images allow an intuitive understanding of morphology and size differences. More spherical particles with higher aspect ratio plot on the right side of the diagram. Detecting the smallest amounts of irregular particles in a large quantity of predominantly spherical particles is a great advantage of DIA. Image Credit: Microtrac MRB
Advantages of DIA and LD over other particle sizing techniques
Some companies still utilize mechanical sieve analysis to determine particle size in metal powders. The absolute lower size limit for sieve analysis is set by the smallest practicable mesh size of 20 µm (air jet sieving), which is significantly larger than the average particle size of many AM or MIM samples.
As a result, air jet sieving is unsuitable for determining the accurate and dependable size distribution of fine powders. It is frequently used to detect the amount of large particles with a single sieve, such as a 45 µm or 63 µm aperture size. Another disadvantage is that sieve analysis provides no information on particle morphology.
In the 1970s, the metal powder industries began using LD to replace sieves. Since then, it is widely employed in these industries and is likely to remain their standard method for certifying and confirming particle size distributions.
Laser diffraction analyzers are simple to use, produce quick and reliable findings, and their technology and properties are well understood. These industries are increasingly using Dynamic Image Analysis for morphological analysis to create QC specifications on shapes to control attributes that size analysis alone cannot identify.
Comparison and Conclusion
As metal injection molding and additive manufacturing become more common, there is greater demand for specially designed metal powders with specified properties. Powder processability is determined by chemical content and particle size and form. The powder must meet a range of requirements depending on the application.
Laser Diffraction size analysis for metal particles is deeply ingrained in these industries and is anticipated to remain such.
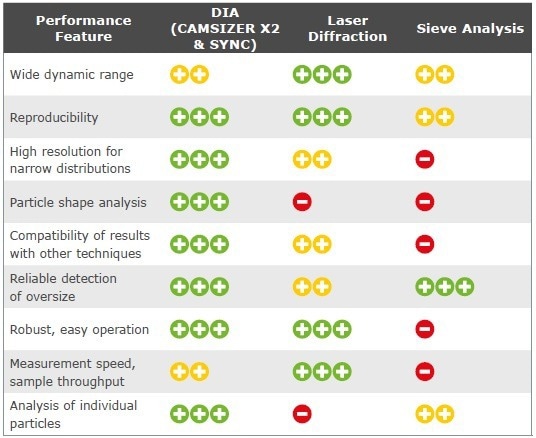
Image Credit: Microtrac MRB
For metal powders, LD and DIA with the SYNC and DIA with the CAMSIZER X2 provide all important data on particle size and shape. When compared to electron and optical microscopy, DIA detects a substantially larger number of particles, making it statistically more relevant and reproducible.
A single measurement takes only 1 to 3 minutes, enabling rapid sample throughput and continual quality control. The SYNC and CAMSIZER X2 are accurate, efficient tools that considerably improve the quality control process for both powder producers and metal part manufacturers.
Characterization of Metal Powder and its AM Products—Density, surface, and porosity
Measurement of the Density of Finely Divided Metal Powder and Porous Metal Bodies with a Gas Pycnometer (ISO 12154)
The knowledge of density, particularly real density, is critical for the characterization of all materials. Density is normally determined as a quotient of mass and volume by calculating these two numbers independently, and weighing the measuring is quite straightforward.
In the case of metallic materials, the volume is frequently measured on a specifically made cuboid test specimen or calculated by displacement of a liquid according to Archimedes’ principle. This is not possible with powdered metals. As a result, gas pycnometry with an inert measurement gas such as helium is recommended in this case.
The gas displacement generated by an inserted specimen is analyzed in a measuring chamber of known volume by monitoring the altered pressure. BELPYCNO L is a completely automated helium multi-volume gas pycnometer for evaluating the volume and density of powders, granulates, and porous solids, as well as pastes and liquids.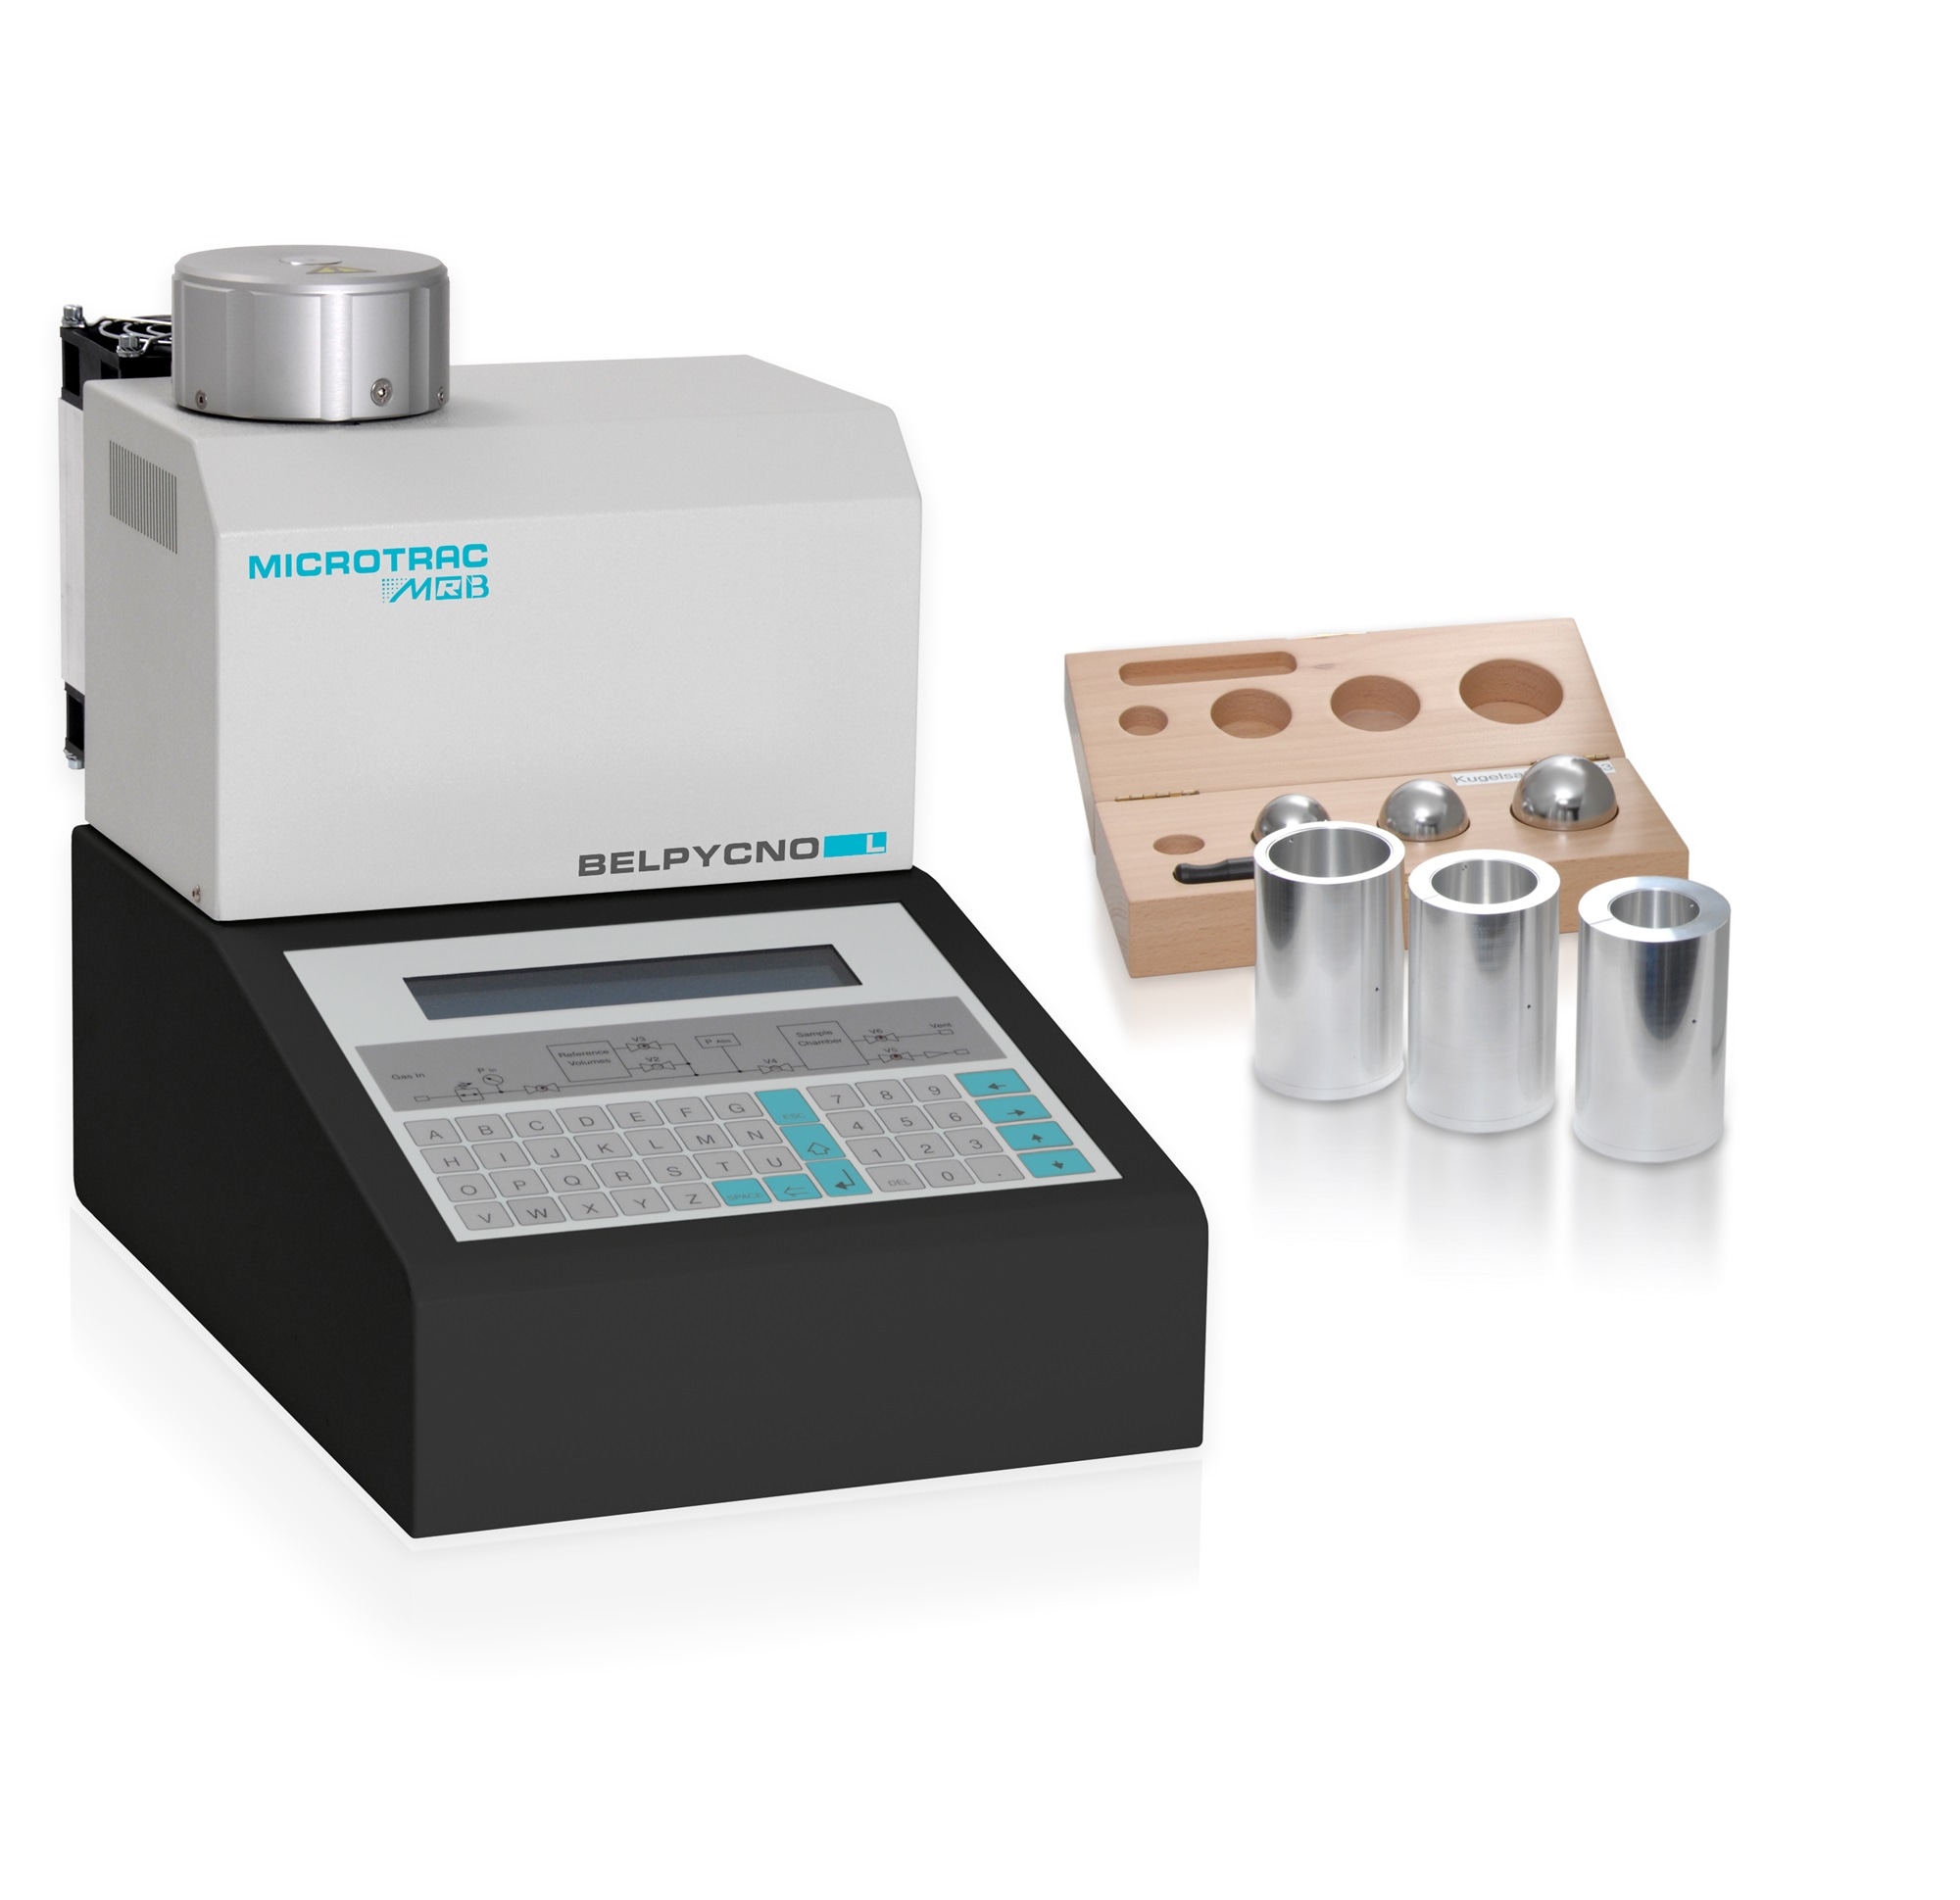
Image Credit: Microtrac MRB
Because of an integrated temperature control (Peltier elements), measurements can be taken in the range of 14 °C to 40 °C ± 0.01 °C (at 20 °C) without being affected by room temperature. As a result, for a given temperature and sample vessel size, a single calibration is enough to measure with precision and reproducibility of 0.01%.
The effective sample throughput is significantly improved because of the significant savings in calibration time.
The multi-volume concept enables the best possible characterization of the materials under investigation through the appropriate mix of sample vessel sizes and three related reference chambers. The use of a high-precision absolute pressure sensor (+/− 0.002 kPa) during a measurement enables permanent adjustment of atmospheric pressure changes.
It is possible to ensure that fine metal powders do not contaminate the reference chamber by depressurizing the test gas from the reference chamber into the sample chamber (DIN 66137).
Image Credit: Microtrac MRB
The sample chamber is easily closed and reproducible thanks to a bayonet lock. Convenient operation is ensured using a computer control or standalone system through an alphanumeric keypad and a display. These characteristics make the BELPYCNO L ideal for harsh environments.
An inbuilt microprocessor regulates the entire measurement and computes the results. Interfaces enable the connection of a PC, a balance, and a printer. The BELPYCNO L can be outfitted with a vacuum pump and, if desired, a humidity sensor. As the measurement chamber and control unit can be separated, the instrument can be used in a glove box, for example, in nuclear technology or for oxygen-free handling in pure metal applications.
Current pressure is displayed and recorded, which is critical for determining acceptable pressure equilibrium times for volume estimation of very fine-pored materials. Entire measurement protocols are also stored.
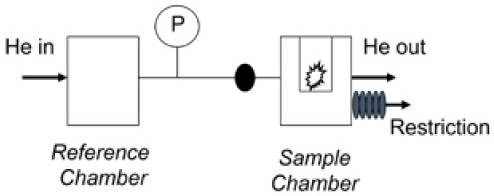
Figure 9. Principle of the temperature-controlled helium pycnometer BELPYCNO L (DIN 66137), with absolute pressure sensor P. Image Credit: Microtrac MRB
BELSORP Mini X—Determine BET Surfaces of Metal Powders Quickly, Easily, Accurately, and Economically (ISO 15901-2, ISO 9277)
The specific surface area (m2/g) of metal powders and other materials is an important characteristic in their characterization and evaluation. The surface area, for example, is important for the possible effect in catalysts, carrier materials (pharmaceuticals, electronics), and filters.
Another consideration is the best way to apply coatings or, in the case of metallic powders, as a quality attribute for processability. An inert measurement gas adsorbs on the particle surface at a steady temperature around the condensation point using sorption techniques. The thickness of this adsorbed layer increases with rising concentration or relative pressure.
The best-known approach for calculating the number of adsorbed molecules in a monomolecular layer from such an experiment is the BET method. Understanding the surface area of a single molecule makes calculating the surface area of the entire sample simple.
In the case of porous materials, the pore size can be calculated using various models from the measurement curve (isotherm) in capillary condensation or pore filling (e.g. BJH, NLDFT). Nitrogen is typically utilized as the sample gas for sorption measurements at 77 K (liquid nitrogen). Measurements with argon gas at 87 K are also an option.
An instrument for measuring sorption that operates on the static volumetric principle is the BELSORP Mini X. The sample vessel is first emptied using a vacuum pump at liquid gas temperature, after which the sample gas is gradually intruded and the accompanying increased pressure is monitored.
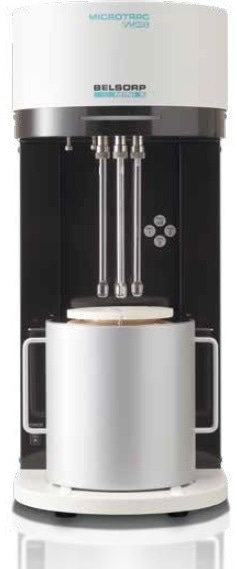
Image Credit: Microtrac MRB
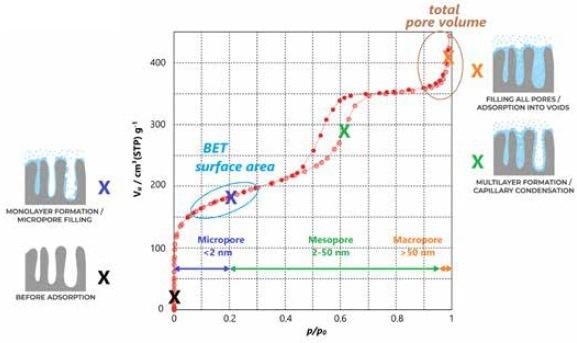
Figure 10. Graphic: Information obtainable from a sorption isotherm. Image Credit: Microtrac MRB
According to the ideal gas law, the adsorbed molecules cause a pressure difference from the expected theoretical pressure. The adsorbed amount and consequently the adsorption isotherm is calculated from this.
After reaching a certain final pressure or saturation pressure, the desorption curve can be determined by evacuating sequentially. Exact sorption measurements necessitate extremely precise temperature measurement and control, as well as pressure measurements, as technically carried out in the BELSORP Mini X.
The BELSORP Mini X can be managed from a PC to store and evaluate measurement results using control and assessment software.
In addition to pore size estimates, which generally take many hours, the three-port instrument can perform up to 12 BET analyses each hour, making it ideal for quality control of tiny powders with high sample throughput.
With its accuracy and high sample throughput, this sorption device fits today's quality control needs and may also be employed in research.
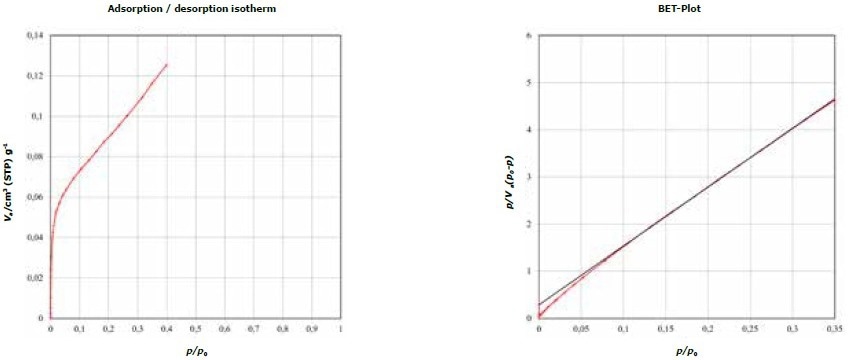
Figure 11. BET Specific Surface Area (SSA) of Metal-powder - Lithium-Nickel-Mangan-Cobalt-Oxide with 0.34m²/g. Image Credit: Microtrac MRB
Pore Size Measurement of AM Manufactured Porous Metals with a Mercury Porosimeter (ISO 15901-1)
Porous materials come in a variety of forms, such as construction supplies and ceramics, but they can also be made from metal powders, such as metal foams and screens, which are generated via additive manufacturing. Porous metals can be utilized for particle filtration (diesel soot), catalyst support, and heat exchangers. Porous metals, on the other hand, may be appealing as low-density components with possible weight savings.
Understanding porosity, pore sizes, and pore volume are essential for characterizing porous materials. Mercury porosimetry is a popular technique in which non-wetting mercury is pushed into the pores at ambient temperature under pressures of up to 414 MPa.
Any unwanted reaction of the porous metal with mercury can be avoided by passivation, such as oxidation. The amount of mercury added determines the pore volume. The pore size (radius, diameter) is inversely proportional to the applied pressure, according to the Washburn equation.
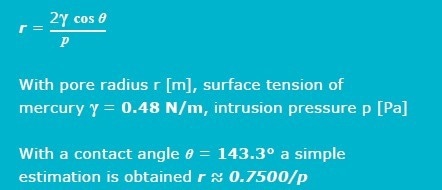
BELPORE mercury porosimeters are used to measure pore diameters ranging from 3.6 nanometers to 1 millimeter. BELPORE mercury porosimeters operate on the P.A.S.C.A.L. principle, which is more than just a pressure unit. It refers to the equilibrium-controlled and optimal control of pressure build-up in the BELPORE porosimeter by “Pressurization by Automatic Speed-up and Continuous Adjustment Logic.”
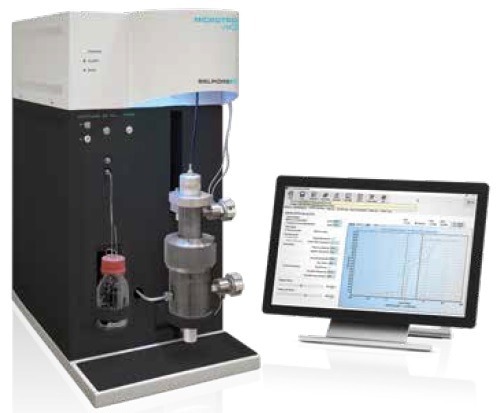
Figure 12. Mercury porosimeter BELPORE. Image Credit: Microtrac MRB
The actual pore system drives this automatic control, which enables quicker measuring times with assured equilibrium conditions and identification of all pores within the specification, up to 20,000 measuring points per analysis. As a result, pressure tables are unnecessary. Because only two types of dilatometers (sample vessels for powder or solids) are needed for all measuring tasks, and no gases or liquid nitrogen are required, operational costs are kept to a minimum.
Other developments include the BELPORE LP low-pressure porosimeter's streamlined operation and an expanded measuring range down to 1 millimeter pore sizes. Vertical degassing and mercury filling on the BELPORE LP allow the degassing pressure to be controlled, enabling the measurement of moist samples without changing the material moisture.
PoreXpert, a 3D assessment software, is optional. Porousness, diffusion, percolation, and other properties can be calculated from porosimetry data with this software.
Pressure ranges for BELPORE porosimeters range from 0.01 kPa to 450 kPa (with mercury filling), 0.1 MPa to 228 MPa, or up to 414 MPa.

This information has been sourced, reviewed and adapted from materials provided by Microtrac MRB.
For more information on this source, please visit Microtrac MRB.