Abrasives are typically used to manufacture bonded abrasive products that are used for polishing, grit blasting, and surface grinding. Their applications include surface processing in the mechanical industry, mechanical planarization manufacture in the electronic industry, and producing kitchen and bathroom cleaners.
It is beneficial to use the synthetic form to preserve the supply and consistency of properties for grains or grit abrasives. Silicon carbide, synthetic diamond, and alumina are some examples of synthetic abrasives.
Specific properties make these materials appropriate for use as abrasives, such as the hardness and toughness of the material. Crucially, it is the particle shape, size, and particle shape or size distribution (PSD) that make the particles of those materials good for application as abrasive grains.
Depending on the required production speed and desired smoothness, different applications require different PSD of abrasive grains. Thus, measuring the PSD is a key part of abrasive grain quality control.
Case Study 1
Measuring the Particle Size and Shape Distribution of Silicon Carbide Abrasive Grains
In this example, four silicon carbide samples that are commonly used for producing polishing agents are discussed. They were manufactured by the same producer across a series of different batches. Sample 1 was manufactured in 2019, and the others were manufactured in 2020.
To measure the size and shape of these abrasive grains, the BeVision S1 image particle size analyzer, which uses the principle of static image analysis (ISO 13322-1), was used. The BeVision S1 is an easy-to-use solution to measure and analyze the size and shape of particles in a range of 1 - 3000 μm.
Both reliable and accurate, the BeVision S1 comes equipped with a high-resolution camera and a precise microscope and provides high-quality particle images. Prior to performing the measurement, a BT - 910 dry dispersion module is utilized to assist in the dispersion of silicon carbide samples onto an 80 x 70 mm glass slide.
The BT - 910 disperses dry powders by breaking potential agglomerates using airflow and ultimately dispersing them evenly onto the glass slide. The particle size and shape of four silicon carbide samples are then measured using the BeVision S1. A transmitted light illumination and a 10x magnification objective lens are employed during this measurement.
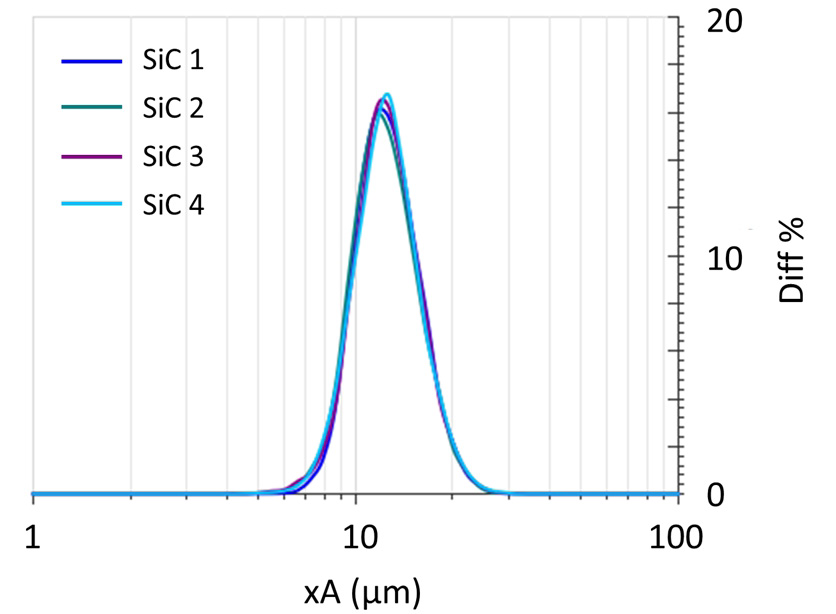
Figure 1. Particle size distribution of silicon carbide abrasives. Image Credit: Bettersize Instruments Ltd.
The BeVision software incorporates a number of useful features, but one of the most crucial features is the capacity to generate a scatter plot by contrasting the relationship between particle size and the particle circularity of four abrasive grain samples.
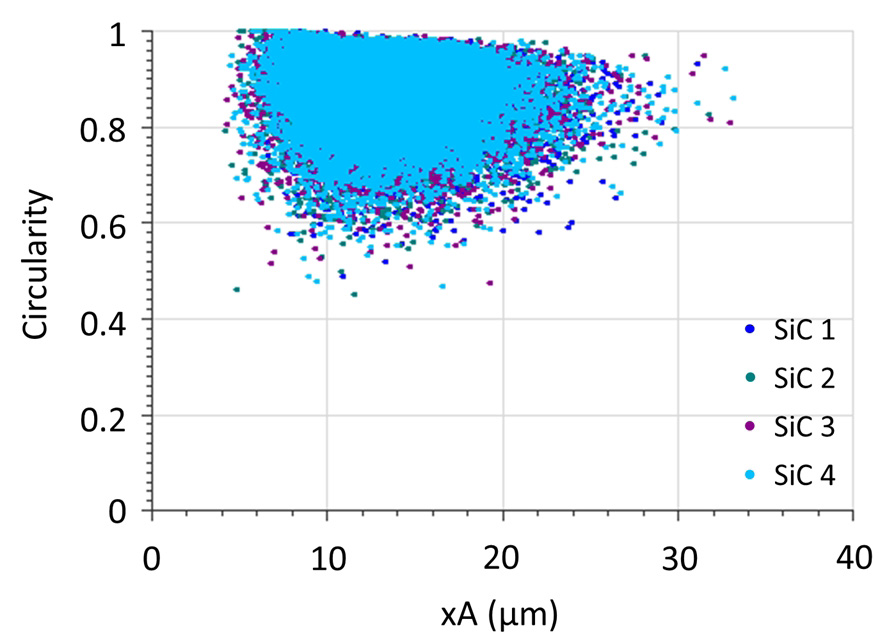
Figure 2. Particle size - circularity scatter plot. Image Credit: Bettersize Instruments Ltd.
Figure 2 indicates that on the larger end of the size distribution (the right side), the scatter points possess a comparatively low circularity value (0.83), suggesting they are less rounded, whereas the finer particles have a greater circularity index of (0.92) signaling that they are more rounded. The coarse, sharp particles of sample 1 and sample 2 are displayed in the images in Figure 3.
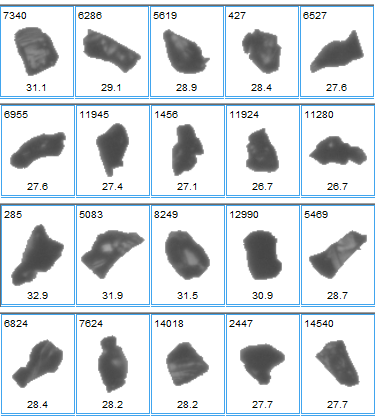
Figure 3. Image of particles of samples 1 and 2 silicon carbide abrasives. Image Credit: Bettersize Instruments Ltd.
Moreover, the distribution of the irregularity can be useful when assessing the general sharpness of the abrasive samples.
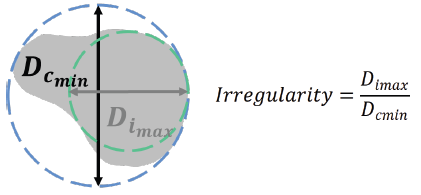
Figure 4. Irregularity of particles. Image Credit: Bettersize Instruments Ltd.
The irregularity, typically referred to as the modification ratio, is the relationship between the diameter of the maximum inscribed circle and that of the minimum circumscribed circle, as displayed in Figure 4. It is a parameter that is extremely useful when describing the sharpness of single particles with just a single digit number.

Figure 5. Particle size - irregularity scatter plot of sample 3 and sample 4. Image Credit: Bettersize Instruments Ltd.
The particle size - irregularity scatter plot, as shown in Figure 5, is worth noting.
Both circularity and irregularity characterize the degree to which the particle (or its projected area) is akin to a circle, but the irregularity is vulnerable to sharp angles on the particle contour. It is generally accepted that a sharper abrasive grain reduces a product’s surface faster, which explains why today’s abrasive industry appreciates the irregularity parameter.
All four samples demonstrate similarity where particle size distribution is concerned, but irregularity can be a deciding factor when trying to establish the difference in abrasion performance.
Particle size was compared using irregularity scatter plots of sample 3 and sample 4. It is demonstrated that the coarser (larger size) particles of sample 4 show greater irregularity (lower irregularity value) and consequently have a faster cutting edge. This indicates that sample 4 will perform better when applied as a polishing agent.
Comparatively, coarser particles in sample 3 are less sharp, as displayed in Figure 5.
Conversely, all four abrasive grain samples possess a relatively low average irregularity value, around 0.61, which is information that should be welcomed by polishing agent producers, as a low irregularity value is related to improved efficiency in polishing agents.
Case Study 2
Measuring Particle Size Distribution of Corundum Abrasive Grains
In this case, analysis of the PSD of three corundum samples with various size distributions was carried out. They were used to create bonded abrasive products, including grinding wheels. It is important to note that as all three samples are loose, coarser corundum abrasive grains, they are suitable for use in the sandblasting process.
The three Corundum samples were manufactured by the same producer, and they were available in a variety of grit sizes (grit numbers), from F60 to F120.
A larger grit number is representative of finer abrasive grit. The F60 and F80 grits are well-suited for the removal of large amounts of materials and rounding off corners. The F120 grits, commonly known as medium grits, are suitable for general-purpose sanding.
A BeVision M1 was utilized for the samples’ particle size and shape analysis. The BeVision M1 is an image particle size analyzer much like the S1, but it also has the capacity to automatically focus on the particles and is fitted with an automated X-Y scanning stage, which makes sure all the particles on the slide are scanned and measured.
The BeVision M1 is an effective solution for the analysis of the size and shape of particles in the range of 1 - 10,000 μm using the static image analysis method.
The SOP test function assists the BeVision M1, allowing it to provide reliable results efficiently, typically in the 3 - 5 minute range.
As with the BeVision S1, a BT - 910 dry dispersion module was applied to disperse the abrasive grains on an 80 x 70 mm glass slide. The PSD results of the abrasive grain samples that the BeVision M1 acquired are shown in Figure 6 below.
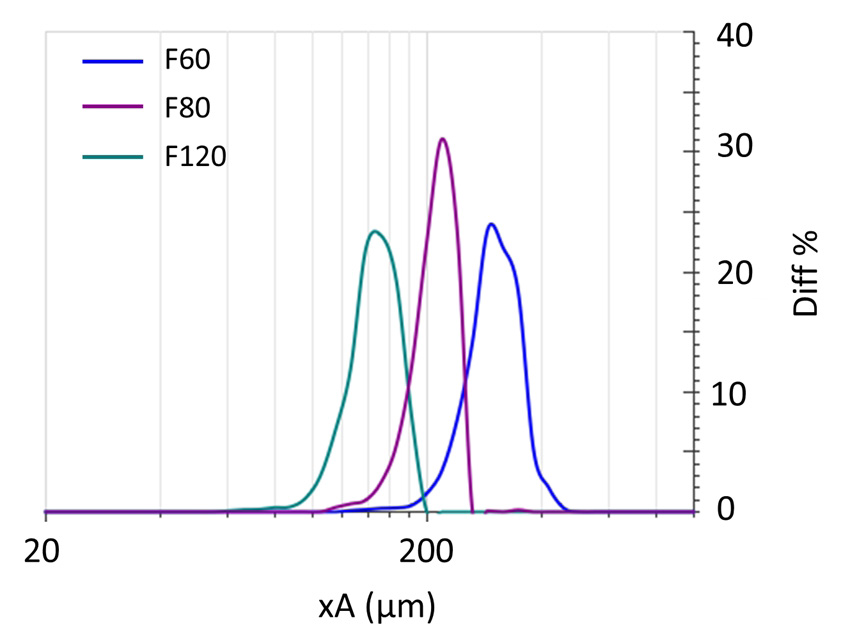
Figure 6. PSD curve of corundum sample F60, F80, and F120. Image Credit: Bettersize Instruments Ltd.
Across the abrasive industry, a number of time-intensive particle sizing methods are applied for product quality control, such as sedimentation analysis and sieving analysis. The BeVision M1 delivers greater resolution PSD results with improved efficiency and offers more detailed information regarding the particles.
The BeVision software can provide a smooth transition between various particle sizing methods, including sieving, sedimentation, and laser diffraction.
Table 1. Particle size distribution result of two sizing methods. Source: Bettersize Instruments Ltd.
| Sample Size (μm) |
Size (μm) |
Sieving (%) |
BeVision M1 (%) |
| F120 |
< 63 |
0.19 |
0.59 |
| 63 – 90 |
6.31 |
8.42 |
| 90 – 106 |
32.5 |
31.45 |
| 106 - 125 |
54 |
53.2 |
| 125 - 180 |
7 |
6.34 |
| > 180 |
0 |
0 |
| F80 |
< 150 |
1.66 |
0.73 |
| 150 – 125 |
6.84 |
6.21 |
| 150 – 180 |
31.5 |
30.57 |
| 180 – 212 |
45 |
46.19 |
| 212 – 300 |
15 |
16.3 |
| > 300 |
0 |
0 |
| F60 |
< 180 |
1.19 |
0.14 |
| 180 – 212 |
5.59 |
5.96 |
| 212 – 250 |
34.5 |
33.45 |
| 250 – 300 |
53 |
53.07 |
| 300 – 425 |
5 |
7.38 |
| > 425 |
0 |
0 |
In this case, prior to running the tests on the BeVision M1, three corundum abrasive samples were analyzed with sieves. Sieving results are displayed in Table 1 for all three Corundum abrasive grains.
There are two things that should be noted when comparing the BeVision M1 result with a sieving result. Firstly, the user should select the most suitable parameter to describe the particle size as measured by a sieve.
Based on the BeVision M1 particle size (area-equivalent diameter, xA) result, there are oversized particles in sample F60 which are larger than 425 microns, which are not displayed in the sieving result.
After investigating further, it turns out that the size parameter minimum Feret diameter (xFmin) offered the best correlation in contrast to the sieving results, which are predicated on the second largest diameter.
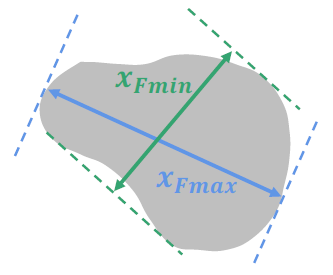
Figure 7. Maximum and minimum Feret diameters. Image Credit: Bettersize Instruments Ltd.
The minimum Feret diameter is determined as the minimum distance between parallel tangents of the particle and related to the “breadth” of the particle.2 In contrast to the area equivalent diameter, the minimum Feret diameter is better suited when trying to determine whether a particle could pass through a sieve opening or not.
Secondly, the distribution model is also key. Image analyzers measure the size of each particle and add them together to form statistics; in this way, image analyzers produce a number-weighted distribution or number distribution.
When conducting sieving analysis, things are different: the content of each particle size interval is made up by adding together the total weight of particles on a sieve.
Assuming particles are homogeneous, the sieving analysis weighted particles by volume, offering a result in volume distribution.
The BeVision software offers a simple transformation from a number distribution to a volume distribution for all three particle size distribution results. Table 1 displays a comparison between all three samples using the BeVision M1 PSD result (xFmin, volume distribution).
In contrast to sieving analysis, a BeVision M1 offers fully comparable results, with enhanced resolution and greater accuracy than the sieves.
Conclusion
The size, shape, and distribution of particles in abrasive grains impact the microtopography and smoothness of an abraded surface.
With an extensive range of particle size and shape parameters available in addition to a selectable range of result presentation methods, the BeVision S1 and the BeVision M1 are both effective instruments that offer particle sizing and shaping solutions that are vital to ensuring good quality control processes across the abrasive industries.
Moreover, the BeVision series image analyzers can supply pertinent particle size and shape analysis parameters that abrasive producers require to accelerate the product quality control process.
Utilizing BeVision’s software, a smooth correlation can be made between the various particle sizing methods at just the touch of a button – from sieves to laser diffraction.
The reliable, efficient BeVision series is the ideal choice for the abrasive industry, whether they be manufacturing abrasive grains, bonded abrasive products, loose grits used in polishing, or many other general industrial applications.
References
- International Organization of Standardization [ISO]. (2007) ISO 8486-2: 2007 Bonded abrasives - Determination and designation of grain size distribution - Part 2: Microgrits F230 to F2000. Geneva: ISO.
- International Organization of Standardization [ISO]. (2008) ISO 9276-6: 2008 Representation of results of particle size analysis - Part 6: Descriptive and quantitative representation of particle shape and morphology. Geneva: ISO.

This information has been sourced, reviewed and adapted from materials provided by Bettersize Instruments Ltd.
For more information on this source, please visit Bettersize Instruments Ltd.
