Solid content is a critical physical characteristic of the slurry substance, and it represents the mass percentage of solids by the weight of the slurry.
This article describes a straightforward method for the measurement of solid content with a gas pycnometer, which is utilized to assess the density of slurries with various solid contents.
In many industries, including paint, battery, ceramic, and coating, solid content affects the quality of the slurries, as well as the manufacture of downstream products.
For example, the viscosity and solid content of the electrode slurry, which governs the final electrochemical properties, has a substantial effect not only on the stability of the slurry but also on the consistency of the battery. Likewise, the solid content of coatings and paints also affects the quality following film formation.
A value that is too high will lead to a thick film, while a value that is too low may cause no film to form at all. To ensure the quality of the paste, the solid content must be determined and controlled.
The current testing method to determine the solid content largely entails taking a specific weight of slurry and drying this in an oven. The remaining solids are subsequently weighed, and the solid weight is divided by the slurry weight.
However, this method is usually time-consuming and does not yield timely analysis results, delaying the processing of production issues. The sample also cannot be reused after analysis.
By measuring the densities of the dispersion medium, slurry, and solids, the gas pycnometer BetterPyc 380 can determine the solid content of the slurry with the use of the following formula:

This approach is based on the gas displacement method and takes an average of three minutes per test while posing no risk to the slurry. To validate the method viability, the BetterPyc 380 was employed to analyze a group of clay/water slurries with known solid content.
Additionally, several measurements were inspected to ensure repeatability.
Experimental
Slurry preparation: 150 g of clay powder is to be placed in an oven for one hour to dry out the water. The dried clay powder is subsequently weighed and dispersed into deionized water to generate the six clay slurries with calculated solid contents of 2.858%, 8.54%, 11.59%, 19.58%, 27.15%, and 40.78%.
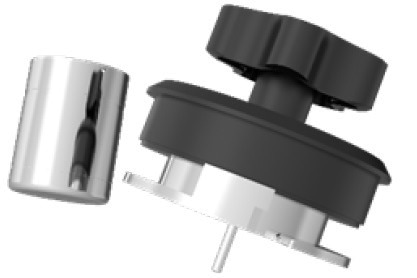
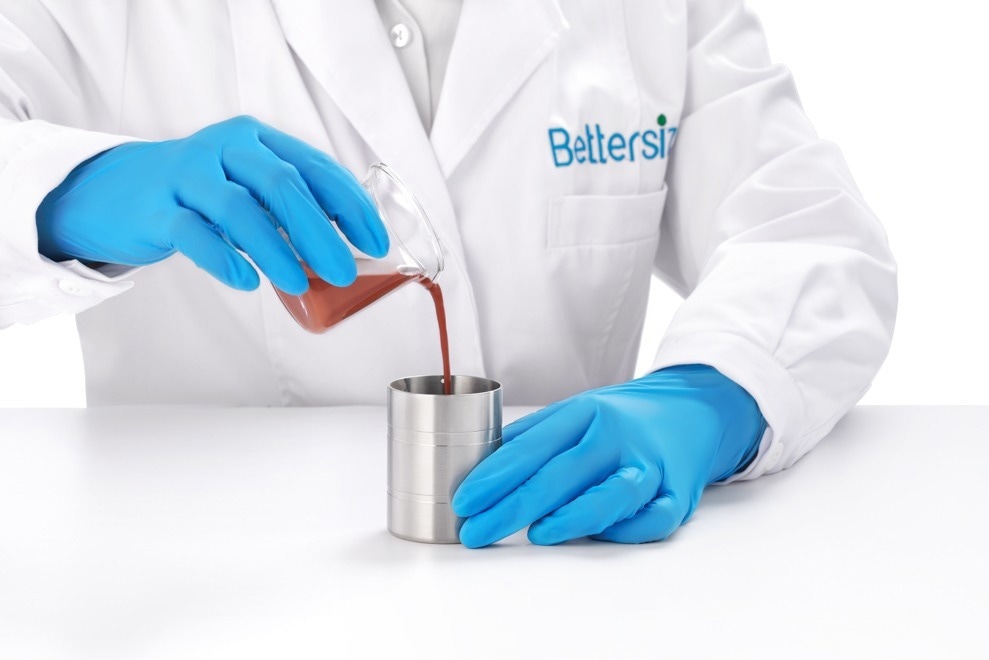
Sample test: Deionized water, dried clay, and slurry are obtained, each filling up two-thirds of the sample cup volume. After the mass is weighed, the BetterPyc 380 was employed to assess the density and the solid content of the slurry.
Table 1 displays the specific experimental conditions. The dedicated sample cup and lid for solid content were utilized to measure the densities of slurry and deionized water.
This cup and lid consist of corrosion-resistant stainless steel, while the cover has a temperature sensor that can measure the temperature by probing inside the liquid.

Figure 1. Dedicated lid and sample cup for solid content. Image Credit: Bettersize Instruments Ltd.
Table 1. Analysis condition of slurry solid content. Source: Bettersize Instruments Ltd.
| Parameter |
Setting |
Parameter |
Setting |
| Temperature |
20 °C |
Sample Cup |
Large |
| Gas Type |
Helium |
Equilibrium |
< 0.0500 psig/minute |
| Purge Cycle |
10 |
Purge Pressure |
19.5 psig |
| Analysis Cycle |
5 |
Analysis Pressure |
19.5 psig |
Results and Discussion
Five cycle tests were performed using the BetterPyc 380 to determine a water density of 0.9985 g/cm3, with the chamber temperature at 20±0.5 °C, controlled by a recirculating water bath. The results are shown in Table 2.
Due to the relationship between temperature and water density, the expected density of water at 20.0 °C is 0.9982 g/cm3. As a result, the density of an aqueous liquid or slurry measured using the BetterPyc 380 is deemed to be an accurate density value.
Before the examination of the solid content of the slurry, the instrument was utilized to determine the true density of the dried clay, which provided a result of 2.7638 g/cm3.
Table 2. Water density measured by the BetterPyc 380. Source: Bettersize Instruments Ltd.
| Cycle |
Temperature (°C) |
Density (g/cm³) |
| 1 |
20.13 |
0.9982 |
| 2 |
20.12 |
0.9985 |
| 3 |
20.15 |
0.9985 |
| 4 |
20.18 |
0.9987 |
| 5 |
20.14 |
0.9987 |
| Average Value |
|
0.9985 |
| Standard Deviation |
|
0.0002 |

Image Credit: Bettersize Instruments Ltd.
Later, six samples were each given a solid content characterization from the instrument. Table 3 demonstrates that the method is highly accurate at estimating the slurry solid content, with an absolute error between the calculated and measured solid contents of less than 0.6%.
Six samples with various solid contents had deviations that did not exceed 0.05%, exhibiting the high repeatability of this method.
In comparison to the traditional dry weighing method, this method reduces human error by employing a fully automatic true-density tester. The single measurement time is also less than three minutes, enhancing the effectiveness of testing and analysis.
Table 3. Comparison between theoretical and measured solid content. Source: Bettersize Instruments Ltd.
| Calculated Solid Content (w/w) |
Measured Solid Content (w/w) |
Absolute Error |
| 1 |
2 |
3 |
4 |
5 |
Average |
Deviation |
| 2.86 |
2.85 |
2.87 |
2.89 |
2.92 |
2.93 |
2.89 |
0.03 |
0.03 |
| 8.54 |
8.32 |
8.37 |
8.39 |
8.43 |
8.44 |
8.39 |
0.04 |
0.15 |
| 11.59 |
11.16 |
11.18 |
11.20 |
11.23 |
11.24 |
11.20 |
0.03 |
0.39 |
| 19.58 |
18.94 |
18.99 |
19.03 |
19.06 |
19.07 |
19.02 |
0.05 |
0.56 |
| 27.15 |
26.59 |
26.63 |
26.65 |
26.68 |
26.70 |
26.65 |
0.04 |
0.50 |
| 40.78 |
40.18 |
40.18 |
40.19 |
40.19 |
40.20 |
40.19 |
0.01 |
0.59 |
Conclusion
This article describes how the BetterPyc 380 gas pycnometer was employed to characterize the densities of dried clay, deionized water, and water/clay slurries in addition to investigating the solid content of the slurry.
The experimental results seemingly demonstrate that the instrument can analyze the slurry solid content with high accuracy. Additionally, the results of multiple experiments displayed outstanding repeatability of the instrument, evidenced by a low standard deviation.
In conclusion, this method is a quality approach for performing solid content characterization as it is accurate, efficient, and dependable.

This information has been sourced, reviewed and adapted from materials provided by Bettersize Instruments Ltd.
For more information on this source, please visit Bettersize Instruments Ltd.
