Reviewed by Emily MageeJun 7 2023
Modern jet aircraft require high-quality fuel to ensure optimal engine performance and safety. Several jet fuel quality parameters are typically measured, and the reference methodology for assessing these parameters involves laborious and expensive laboratory tests.

Image Credit: Shutterstock.com/NadezdaMurmakova
An alternative approach to these measurements is Near Infrared spectroscopy (NIR), which offers a faster and more environmentally friendly solution.
Background
NIR spectroscopy can effectively measure key jet fuel quality parameters such as Cetane index (#), API Gravity, Viscosity, Aromatics, and Distillation (D10, D50, etc).
Compared to traditional laboratory methods, spectroscopic techniques are less time-consuming and require less labor. These methods can be employed in both process settings and laboratories, providing flexibility for refiners.
By incorporating spectroscopic methods into the production process, refiners can effectively control the parameters throughout fuel production.
This article focuses on the application of Process Insights™ hardware and software tools for measuring various jet fuel parameters using fiber optic-based, Near-infrared (NIR) spectroscopy.
The GUIDED WAVE™ NIR-O process spectrometer is specifically designed for process use and includes a built-in multiplexing capability for multiple channels. NIR spectroscopy offers a cost and time-saving alternative to traditional methods, applicable in both process and laboratory environments.
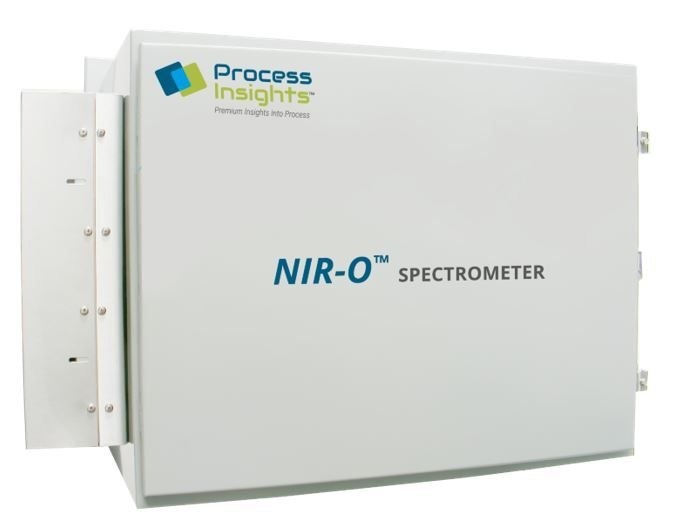
Image Credits: Process Insights - Optical Absorption Spectroscopy
Reference Methods
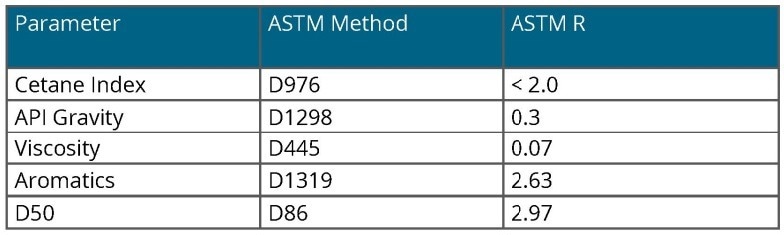
Each of the quality parameters of interest has a standard laboratory reference method, typically specified by ASTM.
Table 1 provides the ASTM reference methods for the parameters described in this context. Each method is accompanied by reproducibility and repeatability statistics, which are valuable for comparing the performance of the NIR spectroscopic method.
Table 1. ASTM Methods. Source: Process Insights – Optical Absorption Spectroscopy
Measurement Background
The NIR region within the electromagnetic spectrum contains valuable information derived from the overtone and combination bands of the C-H, O-H, and NH fundamentals. This information is directly linked to the chemical composition and enables quantitative and qualitative analysis.
By analyzing the NIR spectra of a series of jet fuel samples with known quality parameters, a quantitative model can be developed. This model allows for the measurement of future samples based solely on their NIR spectrum.
The analyzer systems made by Process Insights utilize fiber optics, enabling the sample probe to be situated in remote locations, separate from the spectrometer itself. This capability facilitates the application of the analyzer in a process setting, with optical measurement probes placed directly within the process flow.
Experimental
The NIR spectra of a set of diverse jet fuel samples (including Jet A, JP8, JPS, and A-1 grades) were measured in the range of 1000 to 1600 nm using our NIR Spectrometer. Figure 1 illustrates the absorbance spectra of representative samples acquired with a 1 cm pathlength sample probe.
Within the spectral range of 1100-1300 nm, there are absorbance bands attributable to the second overtones of various CH, CH2, and CH3 fundamentals. The absorbance bands in the range of 1300-1550 nm are a result of combination bands involving CH, CH2, and CH3.
These spectral signatures can be utilized in both quantitative and qualitative methodologies due to the hydrocarbon-based nature of fuels. Figure 2 provides band assignments within the second overtone region.
To establish individual quantitative calibration models, the NIR spectra and laboratory reference data were employed.
Partial Least Squares (PLS) regression, a widely adopted linear modeling method, was utilized for generating these calibrations. PLS allows the incorporation of multivariate spectral data as independent variables in a regression model.
PLS models have the advantage of accommodating large multi-collinear datasets and facilitating the identification of outliers or atypical samples in future measurements. This capability often serves as a means of extending the range of individual models.
For an in-depth discussion of PLS and other multivariate calibration techniques, please refer to Martens & Naes1 and ASTM E1655.2
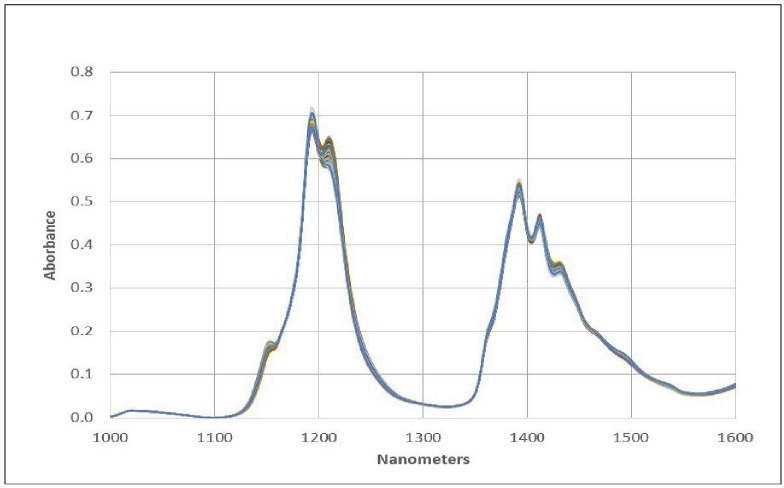
Figure 1. Jet Fuel Spectral Data. Image Credit: Process Insights – Optical Absorption Spectroscopy
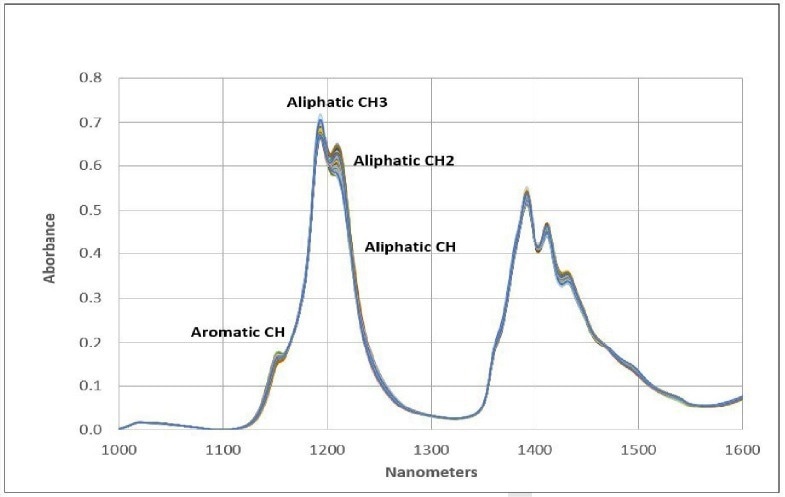
Figure 2. Functional Groups. Image Credit: Process Insights – Optical Absorption Spectroscopy
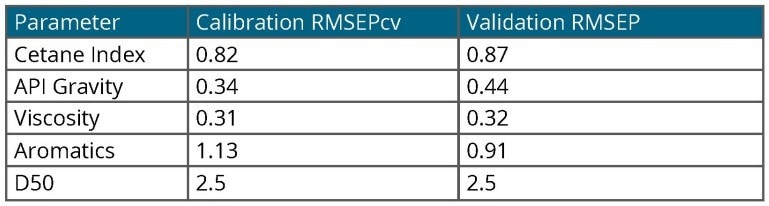
Table 2. Model Accuracy. Source: Process Insights – Optical Absorption Spectroscopy
Results
Multivariate calibration methods, such as PLS, provide users with valuable insights into the overall predictive capability of the model. During development, these methods offer a range of evaluation plots that depict key model parameters. Figures 3, 4, and 5 show some of these plots.
Figure 3 displays the individual sample scores from the Cetane calibration, including a set of validation samples (unknowns). This enables users to assess how effectively the calibration (scores in red) describes unknown samples (scores in blue).
Within the Cetane example, there is one highlighted sample that the model may not adequately describe, possibly indicating an outlier. Figure 4 presents the final regression model equation, providing users with an understanding of the most significant regions in the spectral data.
It also offers valuable guidance to prevent overfitting the model and introducing additional uncertainty into predictions. Finally, Figure 5 exhibits the predicted Cetane against the measured Cetane chart, encompassing calibration model samples and validation samples (unknowns) alongside prediction statistics.
These charts enable users to optimize the multivariate model for individual parameters, if necessary.
In the case of jet fuel analysis, models were created for each parameter and utilized to predict a set of jet fuel validation samples (unknowns). The results are summarized in Table 2, demonstrating good agreement between all parameters and the accepted ASTM reference method.
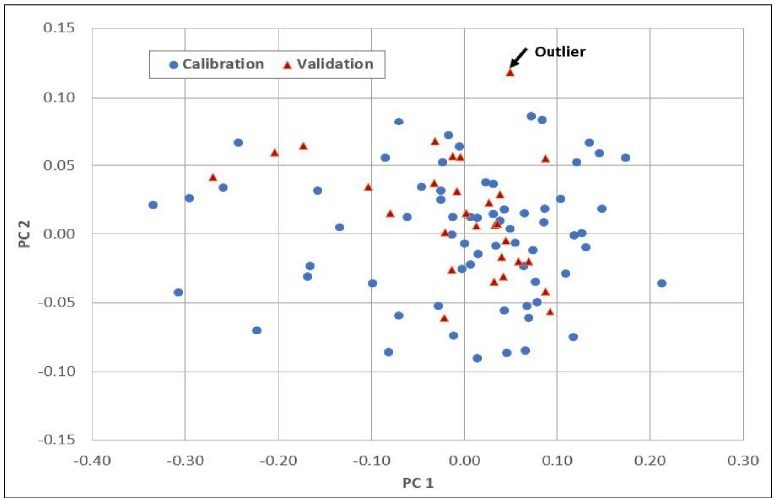
Figure 3. Scores. Image Credit: Process Insights – Optical Absorption Spectroscopy
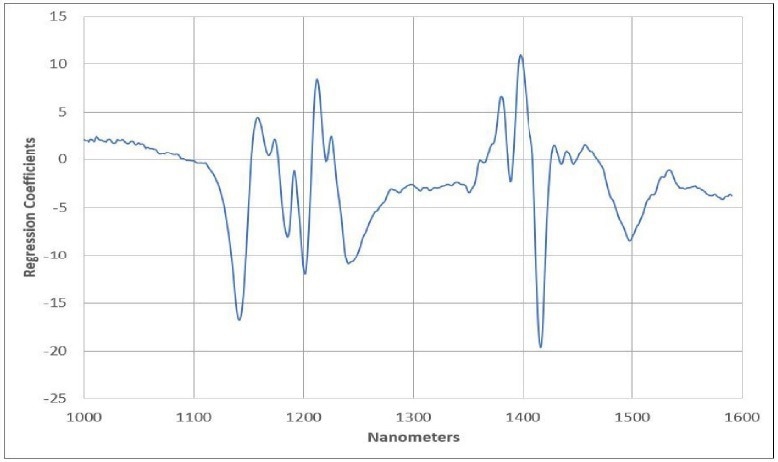
Figure 4. Regression Equation. Image Credit: Process Insights – Optical Absorption Spectroscopy
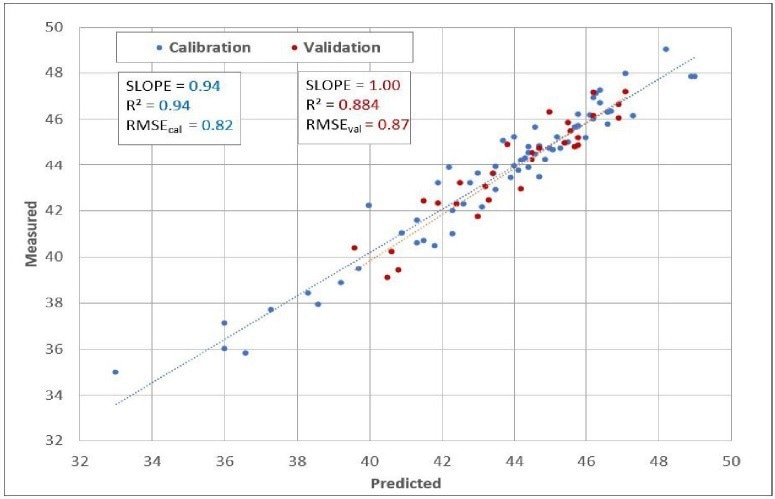
Figure 5. Predicted vs. Measured. Image Credit: Process Insights – Optical Absorption Spectroscopy
Conclusion
As described here, the utilization of NIR spectroscopy for measuring jet fuel quality parameters offers a fast and reliable solution using our hardware and software tools.
This method significantly reduces the reliance on laboratory sample collection, providing real-time results (within seconds) for multiple parameters in complex streams.
References and Further Reading
- H. Martens, T. Naes, Multivariate Calibration, John Wiley & Sons, 1989.
- ASTM E1655 Standard Practices for In-frared, Multivariate, Quantitative Analysis.

This information has been sourced, reviewed and adapted from materials provided by Process Insights – Optical Absorption Spectroscopy.
For more information on this source, please visit Process Insights – Optical Absorption Spectroscopy.