Commonly known as ‘bath salts,’ cathinones are a large compound class belonging to the family of new psychoactive substances (NPS).
Cathinones are often sold as alternatives to more widely-known recreational drugs due to their stimulant effects.1 In addition to being an alternative stimulant for users, cathinones have also been detected as substitutes or adulterants within common recreational drugs, including MDMA tablets (known by its street name of ‘ecstasy’).2
A vast diversity of structurally closely-related compounds characterize the substance class of cathinones, including constitutional isomers.
Some constitutional isomers can be classified differently from other cathinones depending on the regulatory framework surrounding narcotics. Therefore, forensic laboratories ultimately need analytical methods to enable court-proof annotation of the exact isomeric structure of cathinones.
Information on the precise chemical structure is also essential in the context of chemical analysis of drug samples, as constitutional isomers can produce different pharmacologic effects.
Often, structural isomers are indistinguishable when using mass spectrometry because they can result in mass fragmentation patterns and similar retention times. Infrared (IR) spectroscopy has proven highly valuable in such cases, for instance, where substitution at different positions on aromatic rings causes distinct IR adsorption patterns.3
Common IR techniques, such as attenuated total reflection Fourier transform IR spectroscopy (ATR-FTIR) or near-IR spectroscopy (NIR) are well suited in cases where pure compounds are analyzed. However, when analyzing recreational drugs, it is common to encounter mixtures.
On the black market, drugs investigated are often found to contain adulterants, cutting agents, or in cases of tablets, the addition of various excipients and additional tablet fillers. This naturally limits the reliability of the analytical results which are obtained by direct IR methodologies. However, these issues can be overcome when IR spectroscopy is hyphenated to a chromatographic technique, for instance, gas chromatography (GC).
This article will explore the unique strengths of GC-IR for the analysis of the important drug class of cathinones on the structural isomers 3-methylmethcathinone (metaphedrone; 3-MMC), 4-methylmethcathinone (mephedrone; 4-MMC) as well as 3-chloromethcathinone (clophedrone, 3-CMC) and 4-chloromethcathinone (clephedrone; 4-CMC) (see Figure 1).
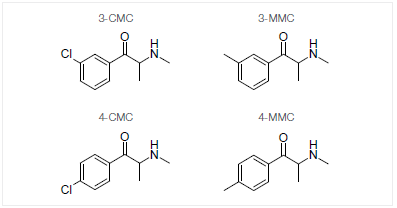
Figure 1. Chemical structures of the investigated cathinones. Image Credit: Thermo Fisher Scientific – Chemical Analysis
Experimental
The Department of Forensic Toxicology and Chemistry from the Institute of Forensic Medicine of the University Basel analyzed several experimental samples comprised of tablets and powders (see Figure 2).
Between 1–2 mg of pure reference standards and 10 mg of homogenized black market samples were weighed and dissolved in 1 mL 0.5 M NaOH, thereby generating the free base of the drugs. A Thermo Scientific Trace 1310 gas chromatograph hyphenated to a Thermo Scientific™ Nicolet™ iS50 FTIR Spectrometer was used to conduct GC-IR analyses.
The FTIR system was equipped with an iS50 GC-IR module, which was then run with a liquid nitrogen-cooled MCT-A detector. Prior separation of the compounds was achieved with an OPTIMA 5 MS GC column (30 m x 0.25 mm, 0.25 μm film thickness) obtained from Macherey Nagel (Oensingen, Switzerland).
A split/splitless injector, maintained at 280 ℃ and operated in splitless mode with an injection volume of 1 μL, was used to configure the GC system. Helium was used at a flow rate of 1.5 mL/minute as a carrier gas.
The GC temperature program began at 90 ℃ and was held for 1 minute. The next stage was a 45 ℃/minute ramp to the final temperature of 270 ℃. This temperature was then held for 5 minutes, which ended in a total run time of 17.4 minutes.
The transfer line and flow cell of the GC-IR module were raised to a temperature of 270 ℃ and 280 ℃, respectively. Series files were then generated at four scans per second at 8 cm-1 resolution. Before every sample injection, the background was measured (100 scans).
The Thermo Scientific™ OMNIC™ Software was used to conduct data analysis via library searches against an in-house library. Certified reference material was used to generate the library, which was obtained from Lipomed (Arlesheim, Switzerland) or provided by the Zurich Forensic Science Institute (Zurich, Switzerland). Additionally, the TBI GC IR gas phase library from Thermo Fisher Scientific was utilized.4
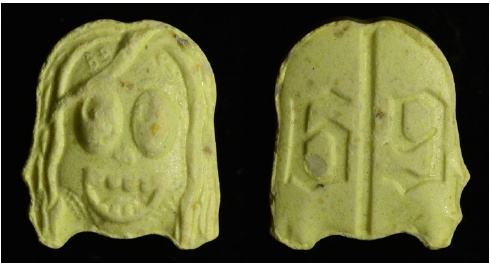
Figure 2. Picture of sample 4. Image Credit: Thermo Fisher Scientific – Chemical Analysis
Table 1. Summary of the analysis results. Source: Thermo Fisher Scientific – Chemical Analysis
| |
Appearance |
Result |
Match |
| Sample 1 |
White powder |
4-CMC |
98.46 |
| Sample 2 |
White powder |
4-MMC |
99.61 |
| Sample 3 |
White powder |
3-MMC |
98.92 |
| Sample 4 |
Yellow tablet |
4-MMC
MDMA |
97.17
99.02 |
Results and Discussion
Table 1 summarizes the results for all investigated samples. The unequivocal distinction of the investigated cathinones was enabled by GC-IR, demonstrated by high match factors (>97) for definite identification. The high distinguishing power of IR spectroscopy is clear when comparing the reference spectra of 3-CMC and 4-CMC depicted in Figure 2, and 3-MMC and 4-MMC shown in Figure 3.
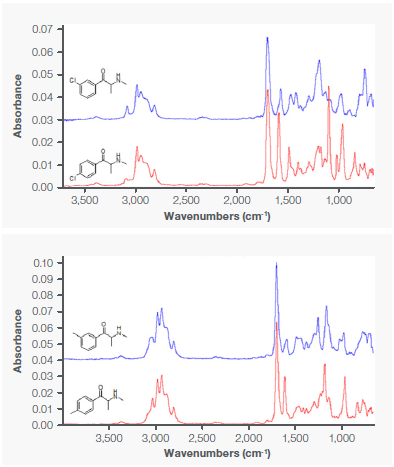
Figure 3. IR Spectra of the 3-CMC and 4-CMC (top) and 3-MMC and 4-MMC (bottom). Image Credit: Thermo Fisher Scientific – Chemical Analysis
3-CMC was found in the white powder of Sample 1. The detected cathinones were 4-MMC and 3-MMC, respectively, for Samples 2 and 3. Finally, although Sample 4 resembled common ecstasy tablets, the GC-IR analysis revealed a mixture of MDMA and 4-MMC. When using direct IR methodologies, mixtures of compounds often impact correct compound annotation and therefore compromise the reliability of results.
GC-IR, however, permitted the fast, reliable, and easy detection of both MDMA and 4 MMC, as seen with the tablet of Sample 3.
Within the Gram-Schmidt profile, both compounds presented distinct peaks. Subjective data interpretation was eliminated, thanks to the use of the command GC Identify in the Mercury GC analysis software, which resulted in fully automatic annotation of MDMA and 4-MMC (Figure 4).
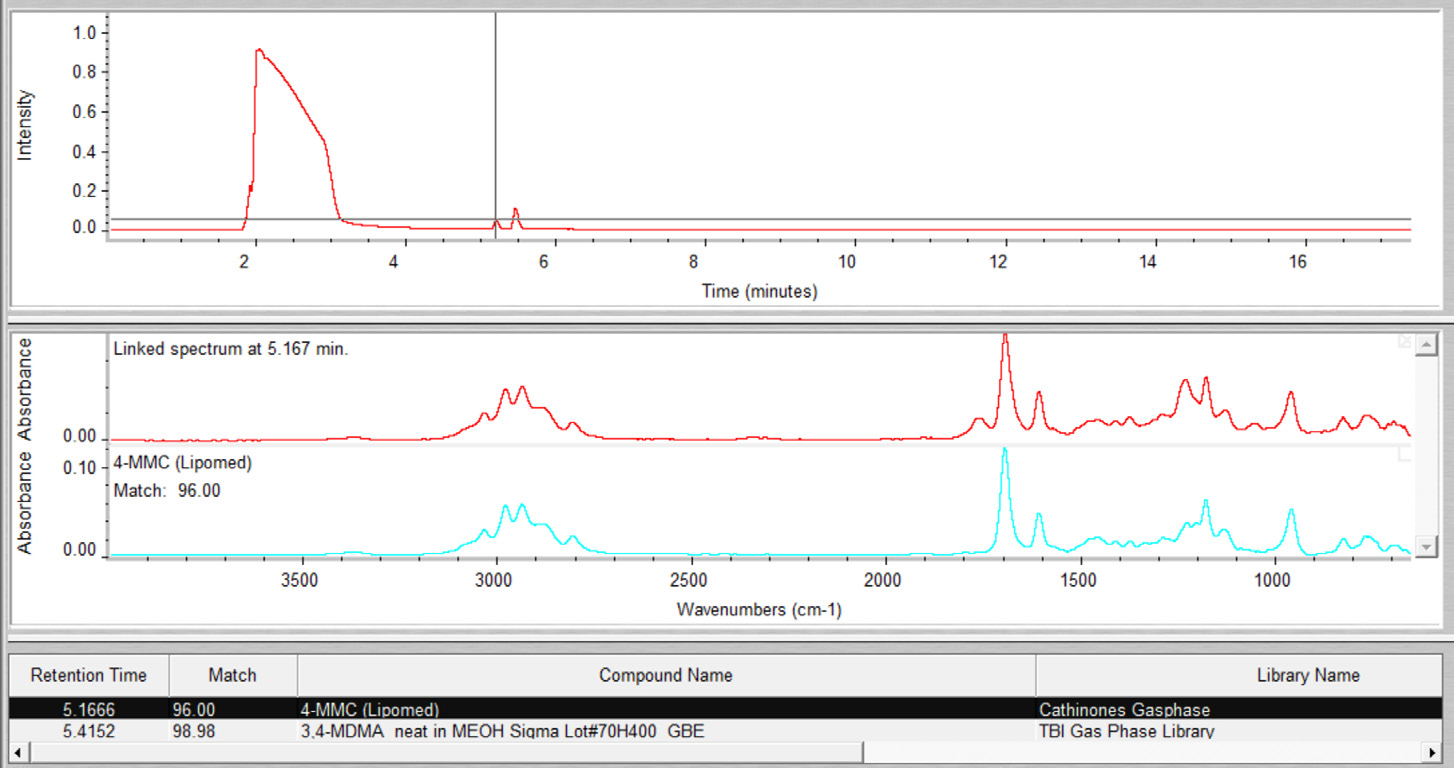
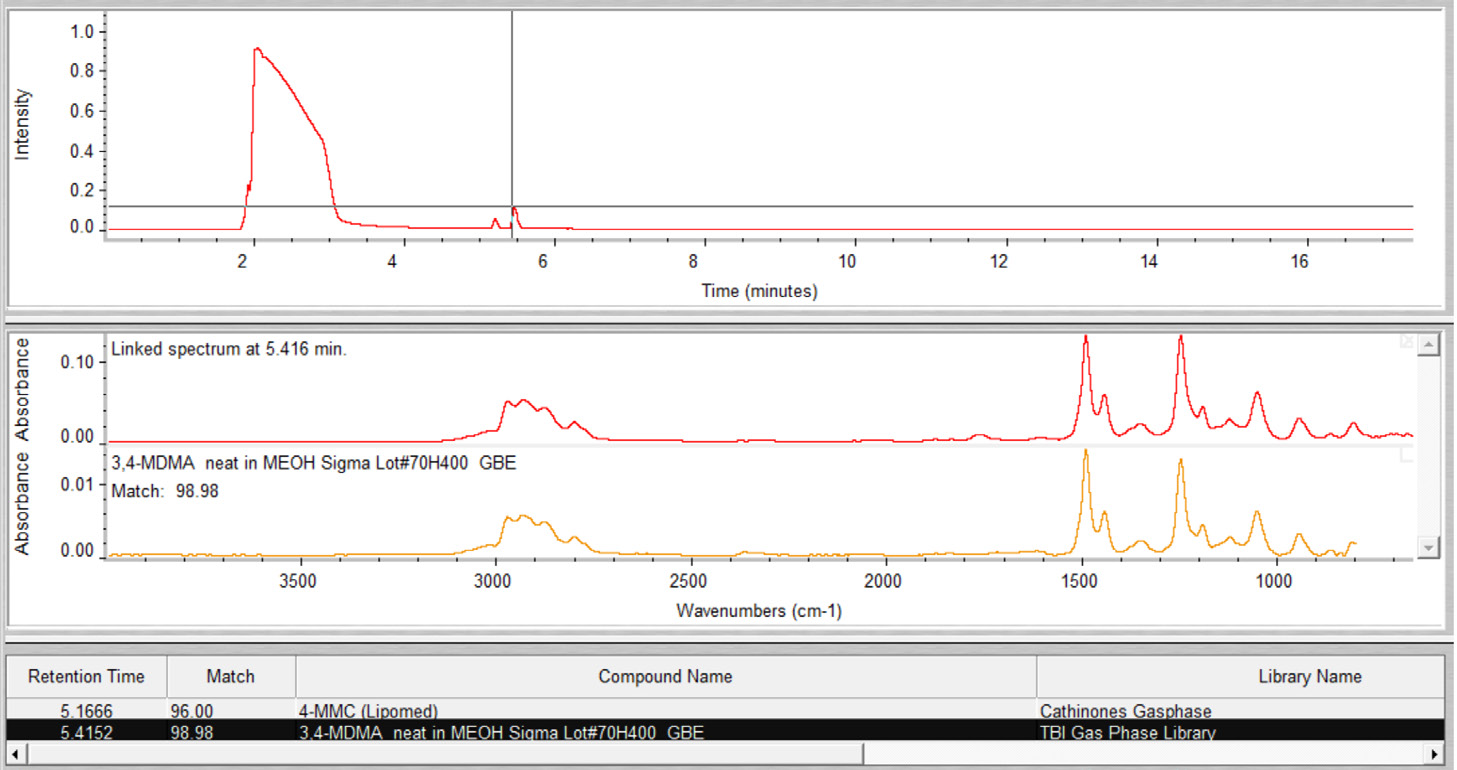
Figure 4. Results from the automated OMNIC Mercury GC data analysis for sample 4. Image Credit: Thermo Fisher Scientific – Chemical Analysis
When comparing the reference spectra of 3-CMC and 4-CMC depicted in Figure 2 and 3-MMC and 4-MMC shown in Figure 3, IR spectroscopy is clearly seen.
Conclusion
Cathinones keep popping up on the recreational drug market, requiring reliable methods for unequivocal and fast identification of constitutional isomers of this compound class in the forensic context.
The easy, fast, and reliable detection of cathinones in drug samples found on the black market was enabled by the use of the GC-IR module by Thermo Fisher Scientific. More challenging samples, such as tablets and compound mixtures, were also successfully analyzed in addition to pure powders.
Furthermore, when applying the Mercury GC analysis software, data handling, and interpretation were relatively straightforward.
References and Further Reading
- Gonçalves, J.L.; Alves, V.L.; Aguiar, J.; Teixeira, H.M.; Câmara, J.S. Synthetic cathinones: an evolving class of new psychoactive substances. Critical Reviews in Toxicology 2019, 49, 549-566, doi:10.1080/10408444.2019.1679087.
- Oliver, C.F.; Palamar, J.J.; Salomone, A.; Simmons, S.J.; Philogene-Khalid, H.L.; Stokes-McCloskey, N.; Rawls, S.M. Synthetic cathinone adulteration of illegal drugs. Psychopharmacology 2019, 236, 869-879, doi:10.1007/s00213-018-5066-6.
- Abiedalla, Y.; DeRuiter, J.; Clark, C.R. GC–MS, GC–MS/MS and GC-IR differentiation of desoxy cathinone derivatives: Cyclic tertiary amines related to MDPV. Journal of Chromatography B 2017, 1048, 38-48, doi: https://doi.org/10.1016/j.jchromb.2017.01.045.
- Application Note - Bath salts and cannabinoids analyzed by GC-IR. Available online: https://assets.thermofisher.com/TFS-Assets%2FMSD%2FApplication-Notes%2FAN52418-bath-salts-cannabinoids-analyzed-GC-IR.pdf (accessed on Nov 18).

This information has been sourced, reviewed and adapted from materials provided by Thermo Fisher Scientific – Chemical Analysis.
For more information on this source, please visit Thermo Fisher Scientific – Chemical Analysis.