The applications of spectroscopic ellipsometry for the precise characterization of liquid-liquid and liquid-air interfaces include surface science, biomedical applications, thin film coatings, and nanoparticles.
Over recent years, the prospect of non-destructive, contactless studies concerning the optical and structural properties of free liquid surfaces has become increasingly important for both biological and chemical applications.
To acquire highly accurate ellipsometric measurements on liquid surfaces, there are certain technical obstacles that must be overcome.
The study described in this article utilized an advanced version of a SE-2000 spectroscopic ellipsometer to eliminate the liquid surface vibrations and to align the liquid surface with a correct orientation about the incident plane.
The applied SE setup delivers precise and accurate measurements of the thickness and refractive index of liquid layers at the liquid-liquid interface.
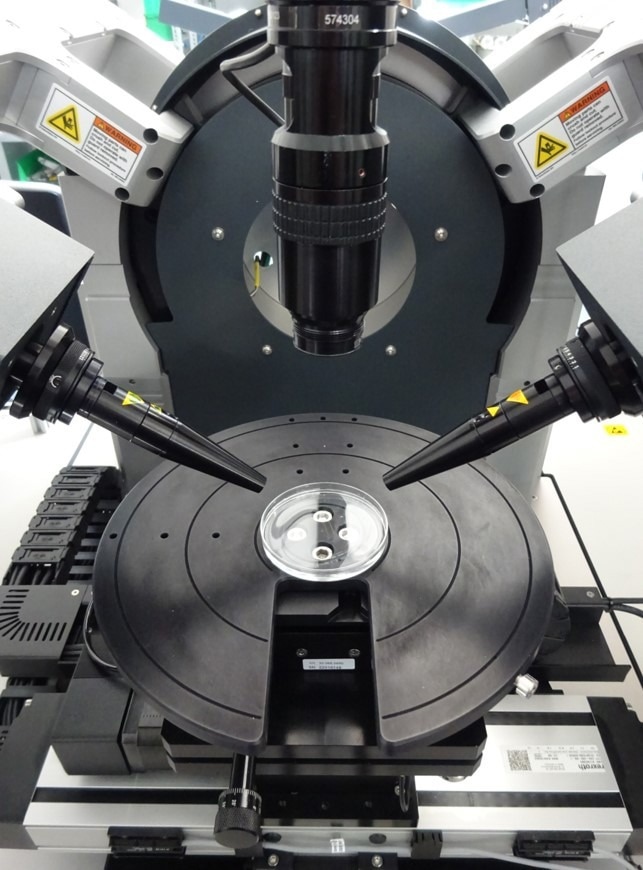
Figure 1. SE-2000 system. Image Credit: Semilab Semiconductor Physics Laboratory
Metrology
The advanced SE-2000 utilized in this study was a state-of-the-art system that provides high-accuracy measurements in the UV-VIS wavelength range.
The thicknesses and optical dispersion of the layers of liquid materials were established using models of the layer structure and fitting the model parameters to ensure that the measured spectra and the simulated spectra match.
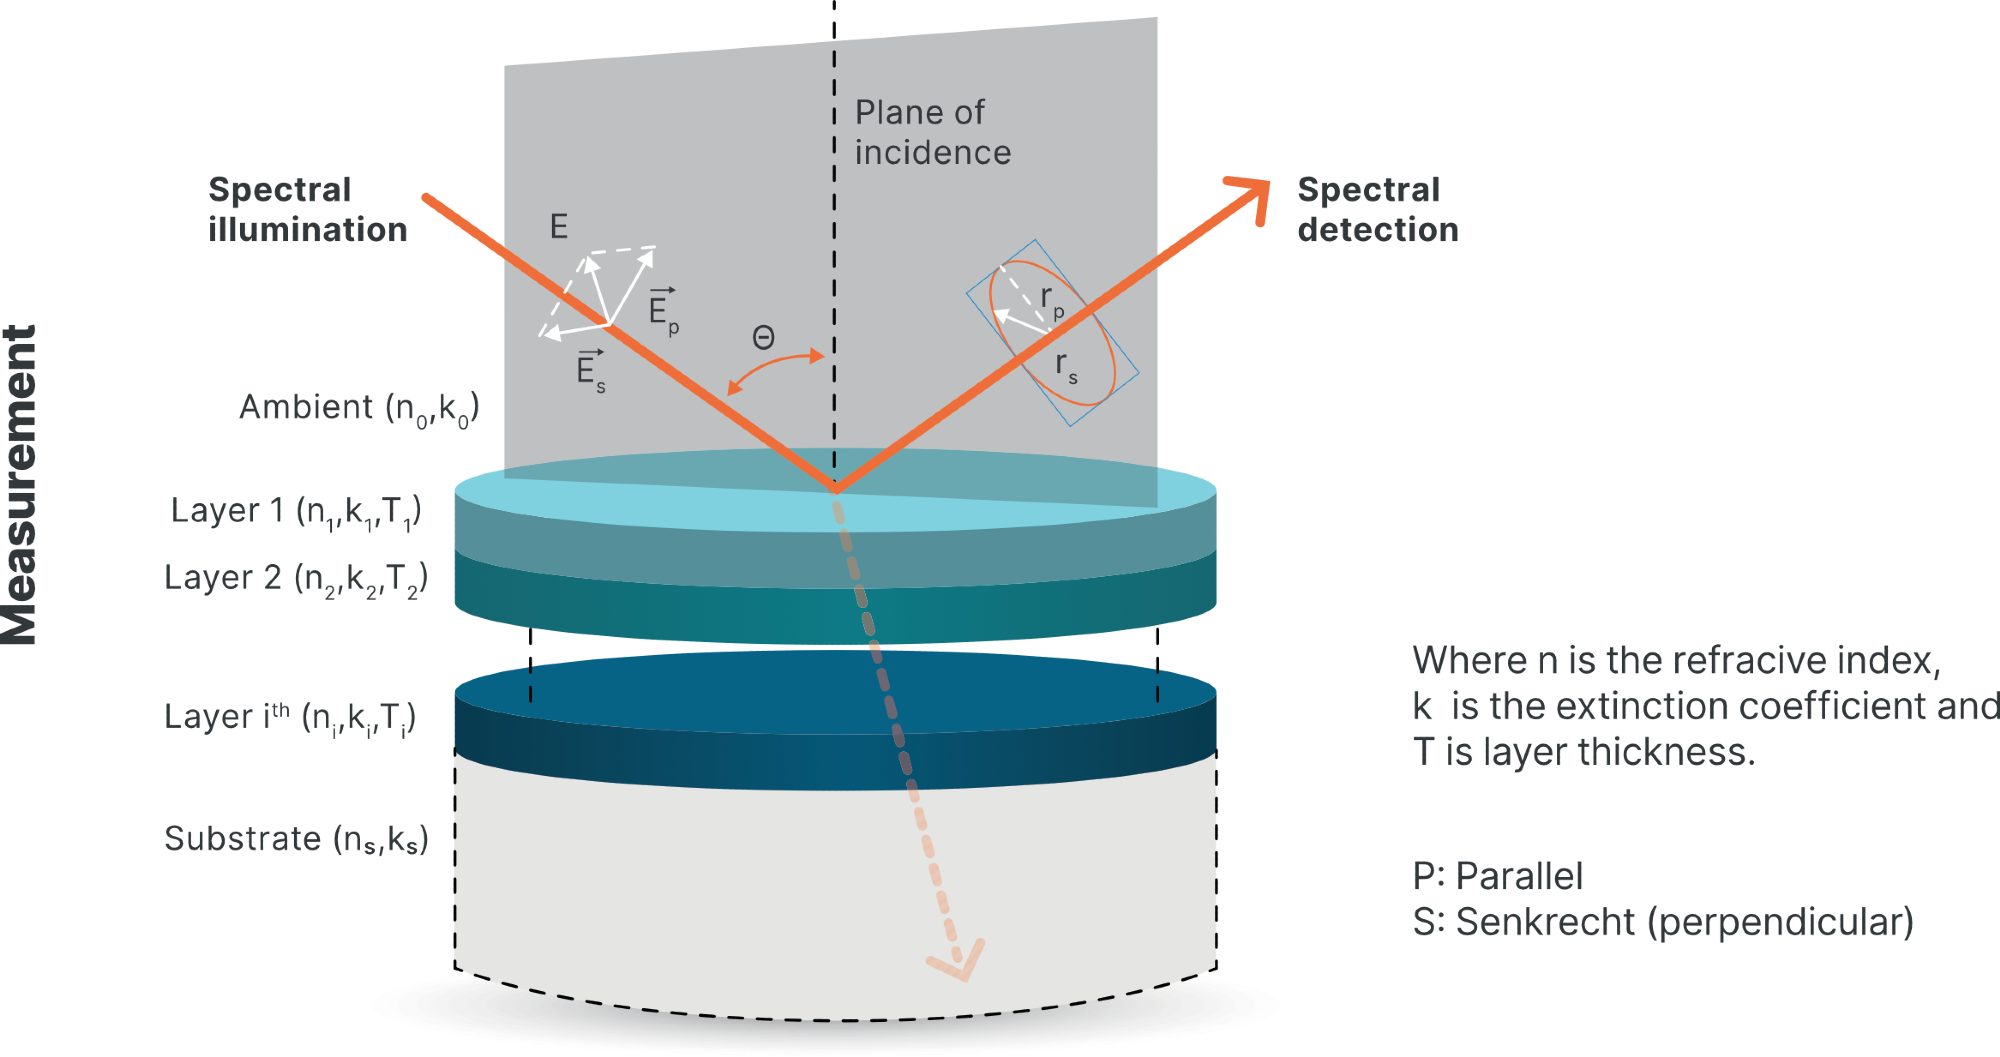
Figure 2. Evaluation example. Image Credit: Semilab Semiconductor Physics Laboratory
Use Case
Measurements were carried out on bulk liquid samples of high-purity distilled water, glycerol, Polydimethylsiloxane (PDMS), and PDMS liquid layer on liquid glycerol substrates with a transition layer between them.
SE measurements were conducted on free liquid surfaces at different angles of incidence (AOI).
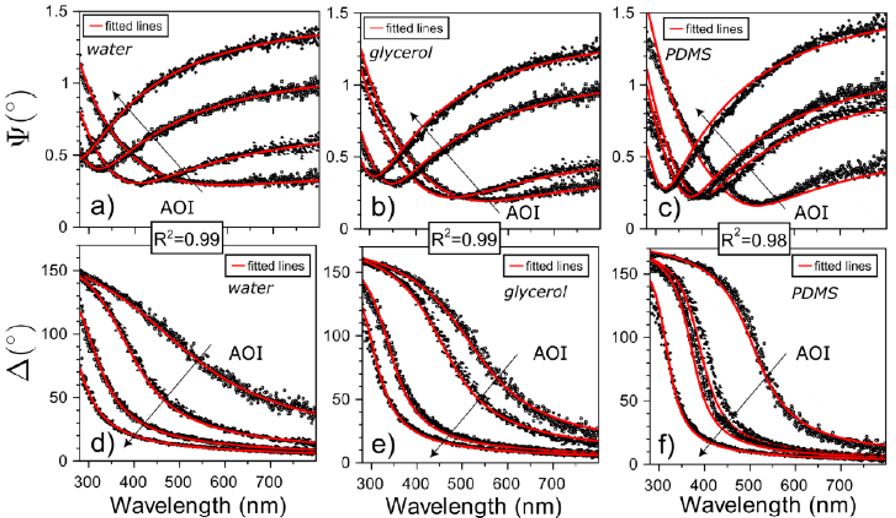
Figure 3. Measured (black symbols) and simulated (solid red lines) ψ (a-c) and Δ (d-f) spectra for various liquid samples. The AOI step is 0.2° in the range of 53.1°-53.7°, 55.6°-56.2° and 54.7°-55.3° for water, glycerol and PDMS, respectively. Image Credit: Semilab Semiconductor Physics Laboratory
The Sellmeier parameters and the refractive indices of all liquid samples were obtained using the analysis of near-Brewster angle SE spectra, as displayed in Figure 4 and Table 1. The Sellmeier equation is given below:

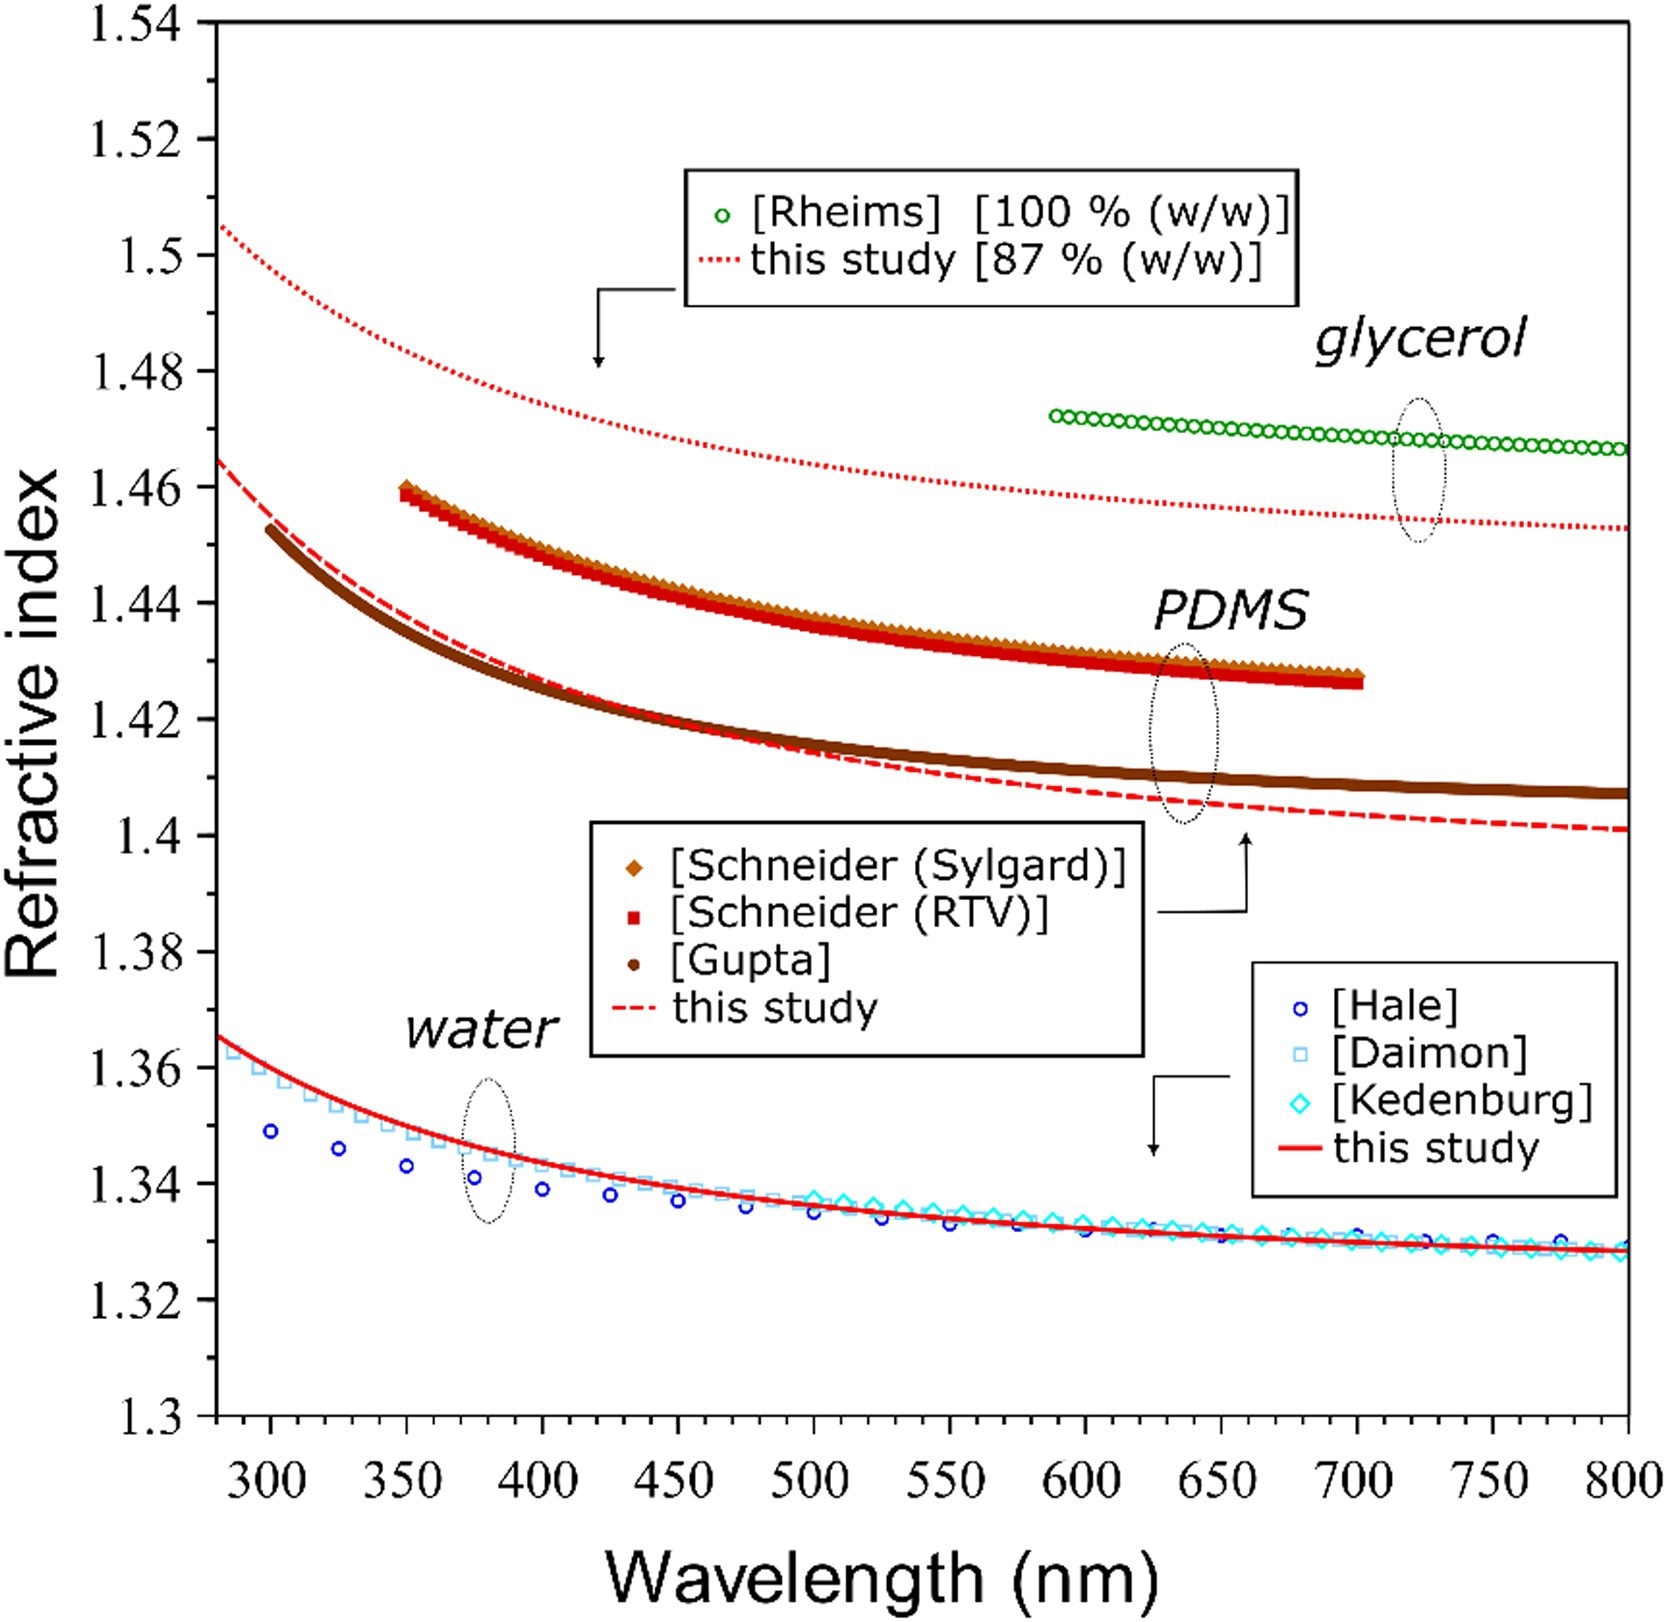
Figure 4. Calculated refractive indices. Image Credit: Semilab Semiconductor Physics Laboratory
Table 1. Calculated Sellmeier parameters for the investigated liquid samples. Source. Semilab Semiconductor Physics Laboratory

Real-Time SE Studies of Liquid-Liquid Structures
Structures with various liquid species at different surface tensions exhibit compelling effects. For example, liquids with low surface tension spread over other liquids with high surface tension, which is referred to as Marangoni spreading.

Figure 5. Optical model for describing the measured spectra. Image Credit: Semilab Semiconductor Physics Laboratory
The difference in surface tension between the two liquid phases causes the spreading of the PDMS drop. This process was captured via real-time SE measurements, from which the layer thicknesses of PDMS are presented.
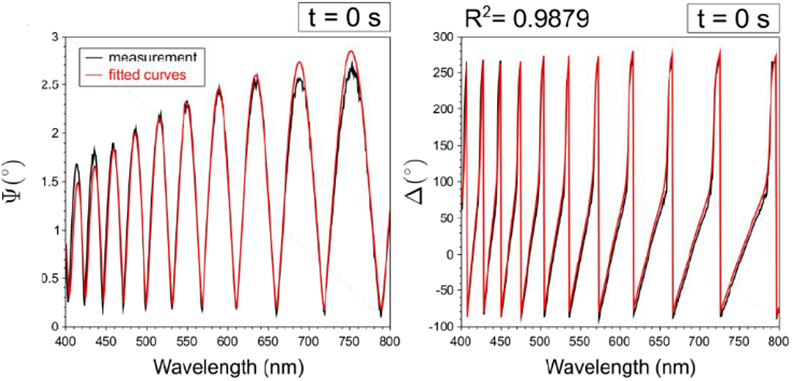
Figure 6. Measured (black curves) and fitted red curves) ψ and Δ spectra of PDMS layer/ Glycerol substrate structure. Image Credit: Semilab Semiconductor Physics Laboratory
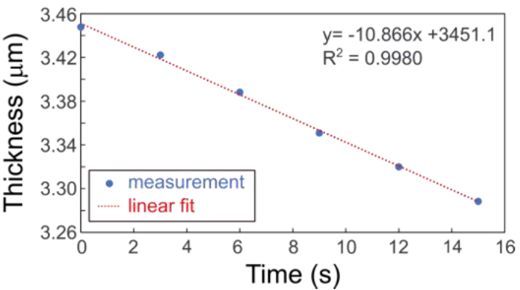
Figure 7. Time evolution of PDMS layer. Image Credit: Semilab Semiconductor Physics Laboratory
SEMILAB Publications
László Makai et al., “Spectroscopic ellipsometry investigation of free liquid-liquid and liquid-air interfaces” in Science Direct Volume 764, 1 January 2023, doi: 10.1016/j.tsf.2022.139634.

This information has been sourced, reviewed and adapted from materials provided by Semilab Semiconductor Physics Laboratory.
For more information on this source, please visit Semilab Semiconductor Physics Laboratory.