Selected ion flow tube mass spectrometry (SIFT-MS) is a powerful platform for selective, real-time analysis of an extensive range of volatile compounds. SIFT-MS is particularly well-suited to mobile monitoring of VOCs.
The Wolfson Atmospheric Chemistry Laboratory (WACL) at the University of York, United Kingdom, has implemented SIFT-MS in its WACL Air Sampling Platform (WASP) for the analysis of volatile organic compounds (VOCs).

Image Credit: Maryna Olyak/Shutterstock.com
For the first time, the platform was leveraged to experimentally verify that motor vehicle screen wash is an unreported source of VOC emissions, specifically for ethanol and methanol.
The research, carried out by Cliff et al., has major implications for policymakers discussing the phase-out of fossil fuel-powered vehicles since electric and hydrogen-powered vehicles are also classified as emission sources.
This article offers a summary of the SIFT-MS results and conclusions made in a peer-reviewed open-access article published as “Unreported VOC Emissions from Road Transport Including from Electric Vehicles” by Samuel J. Cliff, Alastair C. Lewis, Marvin D. Shaw, James D. Lee, Michael Flynn, Stephen J. Andrews, James R. Hopkins, Ruth M. Purvis, and Amber M. Yeoman.
The original article and relevant supporting information offer complete context, experimental results, and a comprehensive discussion of the experiment.
Introduction
Since the mid-90s, there has been a significant decrease in the emissions and concentrations of volatile organic compounds (VOCs) both in Europe and North America. This directly correlates to the introduction of the three-way catalytic converter for exhaust control and the carbon canister for evaporative control.
However, routinely monitoring VOCs is mostly restricted as it only covers a small number of combustion products, and many oxygenated VOCs are not measured despite making up an increasing fraction of emissions.
This article, adapted from the study published by Cliff et al., was the first to experimentally verify and document a non-emission VOC source: motor vehicle screen wash.
Using the WACL Air Sampling Platform (WASP), the researchers conducted their roadside measurement of VOCs (using SIFT-MS) and other pollutants as part of the Observation System for Clean Air (OSCA) project.
During the summer of July 2021 and winter of February 2022 in Manchester, UK, two, three-week measurement periods took place. Data acquired from a previous roadside increment-type analysis for the study of non-exhaust particulate matter emissions was used to calculate real-world road transport VOC emission factors.
Here, the focus is on how the SIFT-MS measurements influenced the researchers’ findings. See Cliff et al.’s journal (and supporting information) for full details.
Methods
1. Instrumentation ― Overview
The WACL Air Sampling Platform (WASP) was placed on location at the roadside measurement site. The full instrument suite is detailed in Figure 1, including the SIFT-MS instrument.
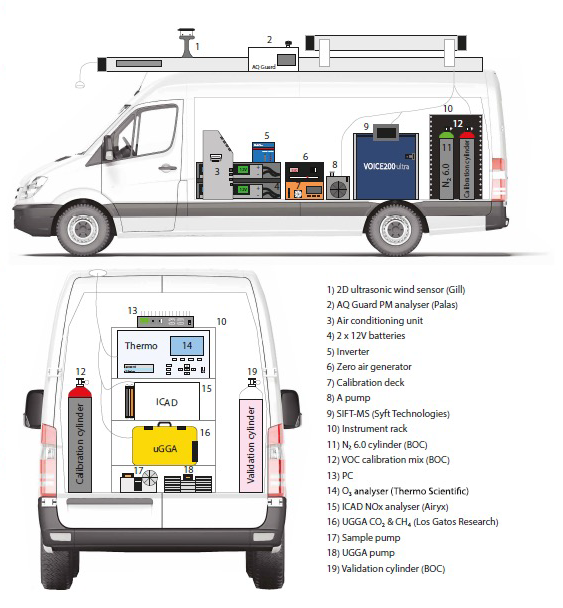
Figure 1. A schematic of the WASP instrumentation configuration during the OSCA campaign. At the top, a side profile numbers each piece of equipment in the list at bottom right. At bottom left, the back profile shows instruments in the instrument rack (10). Image Credit: Syft Technologies
The Manchester Air Quality Supersite (MAQS) was chosen as the urban background as it generates long-term measurements of gases, aerosols, and meteorology. Table 1 outlines the targeted atmospheric species alongside the measurement techniques used. A detailed description of this can be found in Cliff et al.’s journal.
Table 1. Atmospheric species analyzed, and the measurement techniques used, at the respective sampling sites. Source: Syft Technologies
| Species |
Roadside (WASP) |
Urban background |
| VOCs |
Selected ion flow tube mass spectrometry (SIFT-MS) |
Thermal desorption-gas chromatography-flame ionization detection (TD-GC-FID) |
| NOx = NO + NO2 |
Iterative CAvity enhanced Differential optical absorption spectroscopy (ICAD) |
Sum of:
NO: Chemiluminescence analyzer
NO2: Cavity Attenuated Phase Shift (CAPS) analyzer |
| CO2 (plus CH4 and H2O) |
Off-Axis Integrated-Cavity
Output Spectroscopy (OA-ICOS) |
Off-Axis Integrated-Cavity Output Spectroscopy (OA-ICOS) |
2. Instrumentation – SIFT-MS
A SIFT-MS instrument that uses nitrogen as a carrier gas (Voice200ultra, Syft Technologies Ltd, Christchurch, New Zealand) was employed for the onsite roadside quantification of VOC mixing ratios (concentrations). For up-to-date reviews on the SIFT-MS operation theory and its applications, see Smith et al. and Langford.
The instrument background was measured for 5 minutes per hour by taking the output of an in-house built palladium alumina-based zero air generator and feeding it into the instrument inlet. The 5-minute average background mixing ratio was deducted from the ambient mixing ratio measurements of the hour to which it corresponded.
Automated multipoint calibrations were carried out every 72 hours using an in-house developed dilution unit. The calibrations utilized a gravimetrically prepared standard of 1 ppm which was comprised of a range VOCs in ultra-high purity nitrogen (National Physics Laboratory, UK) further diluted with ambient air, humidity zero.
Twenty-three species were targeted using the SIFT-MS instrument which included 21 VOCs and two inorganics as follows: 1,2,4-trimethylbenzene (representing all C3-alkylbenzenes), 3-buten-2-one, acetaldehyde, acetic acid, acetone, acetonitrile, acetylene, benzene, butadiene, butanone, decane, ethanol, formaldehyde, isoprene, methanol, methyl tert-butyl ether, m-xylene (representing ethylbenzene + xylene isomers), nitrous acid (HONO), nitrogen, nonane, octane, propane, and toluene.
See the supporting information for Cliff et al. for more details.
Results and Discussion
Ethanol and methanol were classified as the VOCs present in most abundance measured at both roadside and urban background sites, as shown in Figure 2. The concentrations of these species were invariably an order of magnitude higher than the aromatic species, which is in agreement with measurements made in London, UK.
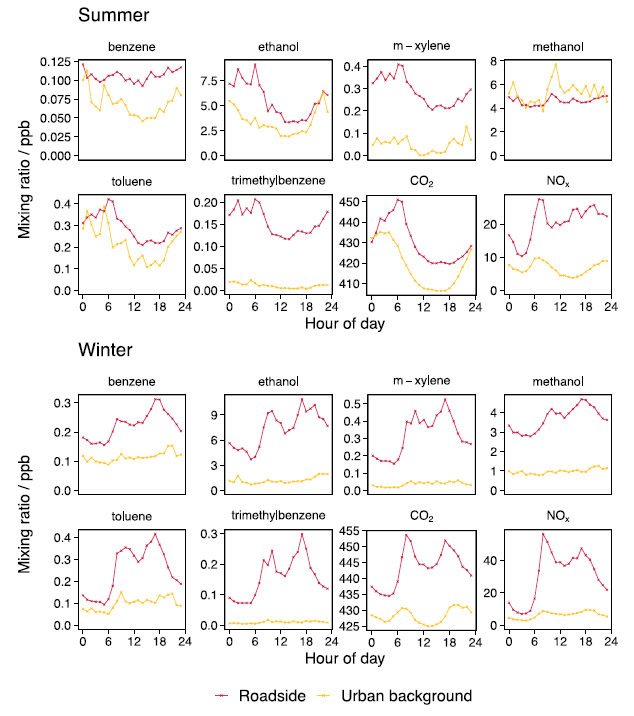
Figure 2. Median average diurnal profiles for six VOCs (benzene, ethanol, m-xylene, methanol, toluene, and trimethylbenzene) and both tracer species (CO2 and NOx) for
the summer and winter at both measurement sites. VOC data in red and yellow are SIFT-MS (roadside) and TD-GC-FID data (urban background), respectively. Image Credit: Syft Technologies
All species (see above) demonstrated a positive increment at the roadside with the exception of methanol during summer which can be attributed to the biogenic methanol emissions at the MAQS location in the surrounding botanical gardens.
There was a significant difference in diurnal shape between the seasons as a result of the meteorological conditions in summer. In winter, the roadside diurnal profiles for all known VOCs and the tracer species (NOx and CO2 ) were tracked consistently alongside traffic flow. Peaks in the morning and evening can be associated with rush hour times.
The summer diurnals were influenced by the atmospheric boundary layer height: a decrease in concentration can be observed as the boundary layer height rises when the morning rush hour ends. Concentration increases again in the evening as the boundary layer height decreases.
The urban background concentrations demonstrate minimal traffic interference as they remain low and stable. Cliff et al. leveraged VOC data to determine emission factors for ethanol and methanol discharged from screen wash by reference to the long-established, reliable emission factors for the NOx and CO2 tracer species.
The experimental verification of the discharge of ethanol and methanol from screen wash has significant implications for policymakers since the current transition policy to electric vehicles does not address reductions of this emission source.
Furthermore, there are implications for modelling atmospheric chemistry and ultimately human health.
Conclusions
Sensitive, real-time field measurement of ethanol and methanol by SIFT-MS contributed strongly to the first experimental verification of a missing atmospheric VOC source: screen wash.
Using SIFT-MS, it was possible to quantify an extensive range of analytes, including inorganics such as nitrous acid, via continuous, real-time analysis. Novel real-time switching of reagent ions also optimized selectivity when paired with the durability of quadrupole mass spectrometry.
SIFT-MS instruments manufactured by Syft Technologies have been proven to be durable and reliable in mobile VOC monitoring applications. Customers have deployed mobile SIFT-MS solutions in the United Kingdom, United States, South Korea, and New Zealand. These units feature remote operation and GPS tracking capabilities that are fully supported by Syft Technologies.
References
Cliff SJ, Lewis AC, Shaw MD, Lee JD, Flynn M, Andrews SJ, Hopkins JR, Purvis RM, Yeoman AM (2023). Unreported VOC emissions from road transport including from electric vehicles. Env. Sci. Tech. https://doi.org/10.1021/acs.est.3c00845.
Langford VS (2023). SIFT-MS: Quantifying the volatiles you smell… and the toxics you don’t. Chemosensors 11, 111. https:// doi.org/10.3390/chemosensors11020111.
Smith D, Španěl P, Demarais N, Langford VS, McEwan MJ (2023). Recent developments and applications of selected ion flow tube mass spectrometry (SIFT-MS). Mass Spec. Rev. e21835. https://doi.org/10.1002/mas.21835.
Wagner RL, Farren NJ, Davison J, Young S, Hopkins JR, Lewis AC, Carslaw DC, Shaw MD (2021). Application of a mobile laboratory using a selected-ion flow-tube mass spectrometer (SIFTMS) for characterisation of volatile organic compounds and atmospheric trace gases. Atmos. Meas. Tech. 14, 6083–6100. https://doi.org/10.5194/amt-14-6083-2021.

This information has been sourced, reviewed and adapted from materials provided by Syft Technologies.
For more information on this source, please visit Syft Technologies.