Sponsored by PerkinElmerReviewed by Olivia FrostJun 19 2024
Rubber includes an extensive range of materials, such as tire rubber, which is made up of intricate and frequently proprietary blends. These blends consist of synthetic and natural elastomers, along with additives like plasticizers, oil extenders, antioxidants, antiozonants, and agents that accelerate vulcanization.
Image Credit: Shutterstock/Andrii Sedykh
ASTM D6370-23 specifies a thermogravimetric technique for quantifying the levels of organics, carbon black, and filler in materials. Through this approach, thermogravimetric analysis can yield critical insights into rubber samples, including detailed profiles of thermal degradation and component quantification.
The PerkinElmer Pyris™ TGA 9 offers a versatile solution to achieve the best possible results in settings that require both simplicity and high performance.
Experimental
Tire tread and sidewall samples were measured using the methodology prescribed by ASTM D6370-23. 10-12 mg samples were used for each analysis, and analyses were performed under an inert purge gas (nitrogen, 75 mL/minute) first and then under an oxidative purge (oxygen, 75 mL/minute) to determine carbon and filler content.
The temperature program was as follows:
- Hold at 50 °C for 2 minutes
- Heat from 50 to 560 °C at 10 °C/minute
- Cool to 300 °C
- Hold at 300 °C for 2 minutes
- Switch sample purge to oxygen (75 mL/minute)
- Heat from 300 to 800 °C at 10 °C/minute
All measurements were performed utilizing the above program with a PerkinElmer Pyris TGA 9 thermogravimetric analyzer (Figure 1).
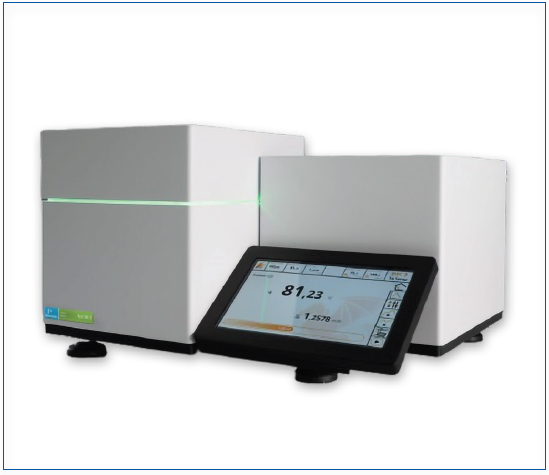
Figure 1. PerkinElmer Pyris™ TGA 9 Thermogravimetric Analyzer. Image Credit: PerkinElmer
Results and Discussion
ASTM D6370 Quantification
ASTM D6370 states that weight loss measurements should be performed between the following temperature ranges for samples with natural rubber and styrene butadiene rubber:
- Organics – 50 to 550 °C
- Carbon Black – 300 to 790 °C
- Ash – Residue at 790 °C
Figure 2 indicates the thermogram of a tire tread with the aforementioned parameters calculated using PerkinElmer’s Pyris software.
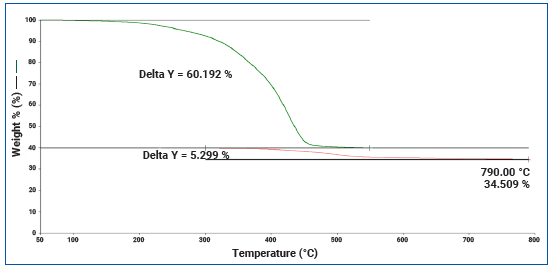
Figure 2. Thermogram of Tire tread subjected to the temperature program specified by ASTM D6370. Image Credit: PerkinElmer
The results from the application of this analysis to tire treads from two separate brands and a tire sidewall are displayed in Table 1.
Table 1. Quantitative Results of three different tire rubber samples measured according to ASTM D6370. Source: PerkinElmer
| Tire Sample |
Organics (%) |
Carbon (%) |
Ash (%) |
| Brand A Tread |
60.19 |
5.30 |
34.51 |
| Brand B Tread |
57.60 |
4.24 |
38.16 |
| Brand A Sidewall |
72.90 |
25.67 |
1.48 |
The most noticeable differences in these samples are observed between the tread and sidewall samples. The sidewall sample contains a significantly higher quantity of carbon black and a significantly lower quantity of filler compared to the tread.
Over the duration of its lifetime, the sidewall of a tire is subjected a lot more sunlight compared to the tread. Carbon black serves many purposes in tire rubber, one of the most important being its role as a pigment to absorb UV light, thereby preventing premature degradation of other materials in the tire.
The higher ash content in the tread is attributed to a higher quantity of inorganic filler, such as silica. This results in a slight softening of the tread, reducing rolling resistance and consequently increasing the fuel economy of the vehicle.
It can also be observed that there are differences between the treads on the two different brands of tires. These differences are due to the performance aspects each manufacturer prioritizes for each model.
For example, Brand A is marketed as a ‘long-life’ tire; thus, one could expect a higher carbon black content to prevent UV degradation while having a lower filler content. Although lower filler content may improve the vehicle’s fuel economy, softer tread could result in faster degradation.
On the other hand, Brand B is marketed as an economical tire, which would feature characteristics opposite to those of Brand A in terms of tread softness and carbon black content.
Comparison of Weight Loss Behavior
Thermogravimetric analysis can also be used to examine tires by investigating how each sample loses weight. PerkinElmer’s Pyris software automatically calculates the derivative weight loss curve for each sample, providing insights into exactly how weight loss occurs.
For example, in the case of the tire sidewall, the analysis revealed that the sample loses 72.90 % of its total weight between 50 and 550 ℃. Figure 3 illustrates the derivative weight loss curve for each of the measured samples.
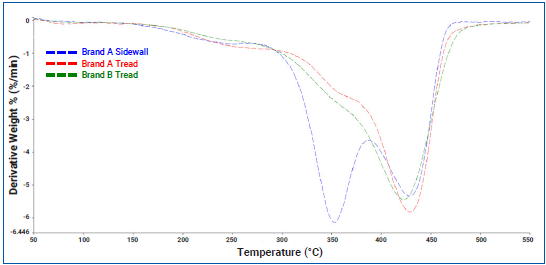
Figure 3. Derivative Weight Loss Curves for Tire Tread and Sidewall Samples. Image Credit: PerkinElmer
The data in Figure 3 highlights a distinct difference in the weight loss behavior between tread and sidewall samples. For instance, while the main weight loss event occurs between 300 and 500 ℃, it appears to happen in two stages.
In the tread samples, this is less apparent but can be identified by a shoulder peak in the derivative weight loss curve around 350 ℃. In contrast, this is much more pronounced in the sidewall samples, as the first part of the weight loss contributes more significantly than the second.
The derivative weight loss curve also provides a clear indication of the loss of volatiles around 200 ℃. To understand more about the decomposition process of tire rubbers, the TGA 9 could be coupled with FTIR spectroscopy or GC/MS to identify the gases that evolved during degradation.
Summary
The PerkinElmer Pyris TGA 9 offers a versatile yet powerful solution, enabling users to meet the requirements of standard methods while also gaining deeper insights into each sample.
This article has demonstrated how the TGA 9, along with PerkinElmer’s Pyris software, can reliably perform the tasks needed to quantify organic, carbon black, and ash content in rubber samples as per ASTM D6370. Additionally, it facilitates a better understanding of the degradation process of each sample if required.
This information has been sourced, reviewed and adapted from materials provided by PerkinElmer.
For more information on this source, please visit PerkinElmer.