Today’s standards define airborne particle monitoring in units of particles per cubic meter (particles/m3).
These standards tend to require sampling an entire cubic meter (1 m3) to establish an accurate measurement of airborne particulate levels. Therefore, if using a standard aerosol particle counter that samples 1-cubic-foot per minute (1 CFM), more than 35 minutes will be needed to sample 1 m3.
Particle Measuring Systems has developed the Lasair® III 5100 Particle Counter (Figure 1), which samples volumetric flow rates of 100 liters per minute (LPM). This article outlines the benefits of sampling at higher flow rates.
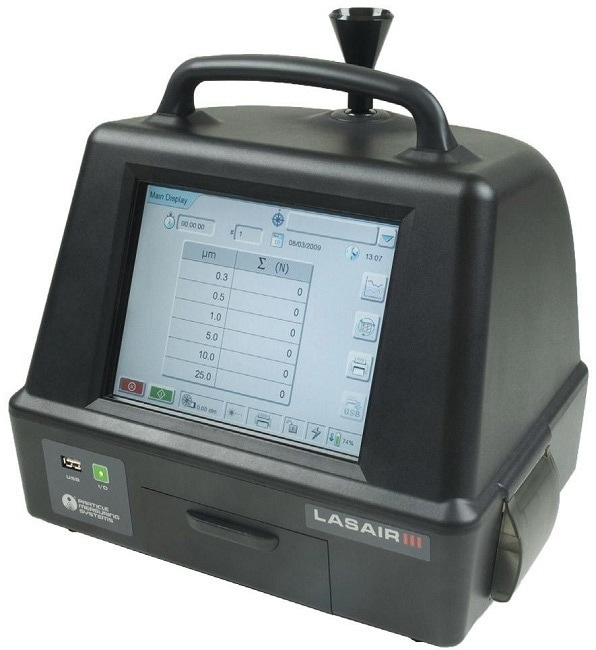
Figure 1. Lasair® III 5100 Aerosol Particle Counter. Image Credit: Particle Measuring Systems
A key benefit of sampling at higher flow rates is the decreased time needed to certify a cleanroom environment (Figure 2). When the cleanroom area is extremely large, more sampling locations are required, which can drive exponential rises in sampling time.
Subsequently, several procedural standards may require sampling a full cubic meter of air, so using a particle counter with higher sampling flow rates will quickly meet those standards.
The cleanroom standard ISO 14644-1, which is most frequently referred to, defines the contamination limits with respect to particles/m3. If an entire cubic meter of air needs to be sampled for a specific test, the test will require only 10 minutes at flow rates of 100 LPM, compared to 35.3 minutes at flow rates of 28.3 LPM and 20 minutes at flow rates of 50 LPM.
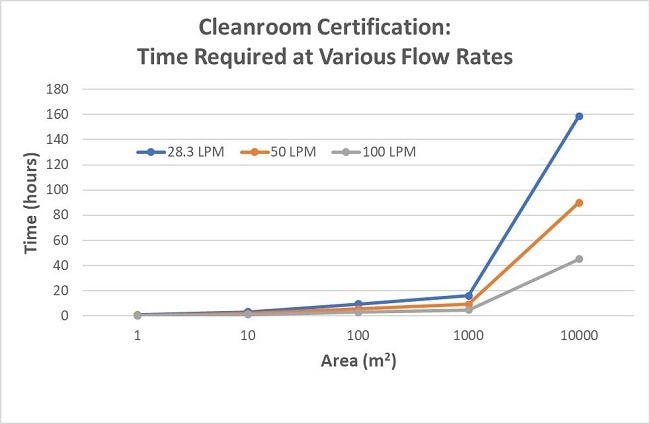
Figure 2. Times required to certify different size cleanrooms using particle counters with 28.3 LPM, 50 LPM, and 100 LPM sample flow rates. Image Credit: Particle Measuring Systems
Table 1. 14644-1 Cleanroom Classification Limits. Source: Particle Measuring Systems
| Class |
Number of Particles per m3 |
| 0.1 µm |
0.2 µm |
0.3 µm |
0.5 µm |
1.0 µm |
5.0 µm |
| ISO 1 |
10 |
|
|
|
|
|
| ISO 2 |
100 |
24 |
10 |
|
|
|
| ISO 3 |
1 000 |
237 |
102 |
35 |
|
|
| ISO 4 |
10 000 |
2 370 |
1 020 |
352 |
83 |
|
| ISO 5 |
100 000 |
23 700 |
10 200 |
3 520 |
832 |
|
| ISO 6 |
1 000 000 |
237 000 |
102 000 |
35 200 |
8 320 |
293 |
| ISO 7 |
|
|
|
352 000 |
83 200 |
2 930 |
| ISO 8 |
|
|
|
3 520 000 |
832 000 |
29 300 |
| ISO 9 |
|
|
|
35 200 000 |
8 320 000 |
293 000 |
The ISO Cleanroom Classifications (see Table 1) clearly contrast with the FS-209E standards, which were based on particles per cubic foot (particles/ft3). This is crucial because it has an important influence on the way particle counters report data. Most particle counters operate at flow rates of 1 CFM, which corresponds to 28.3 LPM. To convert particles/ft3 to particles/m3 involves multiplying particles/ft3 by 35.3.
Sample Volume
Table 1 highlights the challenges faced when certifying ISO Class 2 and lower; particularly the required sample volume and the sampling time. ISO 14644-1 Annex B involves sampling appropriate volumes of air to ensure at least 20 particles are captured. The volume associated with each ISO Class is derived from the following equation:
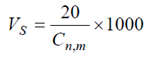
Where
Vs represents the minimum single sample volume per location (in liters)
20 Number of particles counted if the particle concentration corresponds with the class limit
Cn,m The class limit (n) for the number of particles/m3 and the particle size (m) for the specific class.
To ensure a cleanroom meets ISO standards for certification, enough sample volume must be collected at each location, including at least 20 particles, which is representative of a statistically significant sample.
Table 2 shows the minimum sample volume requirements at each sample location in line with ISO 14644-1.
Table 2. Minimum Sample Volume (in Liters) Required per ISO Class. Source: Particle Measuring Systems
| Class |
Certification Particle Size |
| 0.1 µm |
0.2 µm |
0.3 µm |
0.5 µm |
1.0 µm |
5.0 µm |
| ISO 1 |
2000 |
|
|
|
|
|
| ISO 2 |
200 |
834 |
2000 |
|
|
|
| ISO 3 |
28.3 |
85 |
196 |
572 |
|
|
| ISO 4 |
28.3 |
28.3 |
28.3 |
57 |
241 |
|
| ISO 5 |
28.3 |
28.3 |
28.3 |
28.3 |
28.3 |
|
| ISO 6 |
28.3 |
28.3 |
28.3 |
28.3 |
28.3 |
69 |
| ISO 7 |
|
|
|
28.3 |
28.3 |
28.3 |
| ISO 8 |
|
|
|
28.3 |
28.3 |
28.3 |
| ISO 9 |
|
|
|
28.3 |
28.3 |
28.3 |
Table 3. Minutes Required to Sample Locations using Different Flowrates. Source: Particle Measuring Systems
Particle
Counter |
Flowrate |
Max
Sensitivity |
ISO Class |
| 1 |
2 |
3 |
4 |
5 |
6 |
7 |
8 |
9 |
| Lasair III 110 |
1.00 CFM (28.3 LPM) |
0.1 µm |
71 |
71 |
21 |
9 |
1 |
|
|
|
|
| Lasair III 310C |
1.00 CFM (28.3 LPM) |
0.3 µm |
|
|
21 |
5 |
1 |
1 |
1 |
1 |
* |
| Lasair III 350 L |
1.78 CFM (50 LPM) |
0.3 µm |
|
|
15 |
5 |
1 |
1 |
1 |
1 |
* |
| Lasair III 5100 |
3.53 CFM (100 LPM) |
0.5 µm |
|
|
|
3 |
1 |
1 |
1 |
1 |
1 |
*Requires an aerosol diluter
When any type of testing is being conducted, time is crucial, and finding ways to save time can result in a higher return on investment. Airborne particle monitoring is no exception, and using particle counters that sample at higher flow rates can supply more data in less time.
The time saved allows the focus to focus on process improvement rather than distracting users with certifications and process monitoring. Table 3 outlines the time taken, in minutes, to acquire statistically significant data for the various ISO Classes.
Although the Lasair III 5100's flow rate is double that of the Lasair III 350L, the latter can sample ISO Classes 2 and 3 in shorter periods of time. The reason is that the Lasair III 350L’s higher sensitivity at 0.3 μm will count 20 particles in quicker succession because, within a typical cleanroom environment, the concentrations of smaller particles tend to exceed those of larger particles.
However, the Lasair III 350L cannot sample ISO Class 7 and higher, so the Lasair III 5100, with its higher sample rate and versatility, is the preferred option for many cleanroom certifications and monitoring applications.
The "Sequential Sampling” method significantly reduces the volume needed to certify an area. It establishes a minimum required sample volume derived from the volume needed to capture twenty particles at the certification particle size based on the count thresholds in the ISO standard displayed in Table 1.
Larger certification particle sizes will need a considerably larger sample volume; thus, longer sample times are necessary to ensure 20 particles are captured for statistical significance; similarly, cleaner ISO certification levels demand larger sample volumes. Table 4 summarizes the sample volumes required for ISO 3 and ISO 5 at various certification particle sizes.
Table 4. Required sample volume for certification by ISO and certified particle size. Source: Particle Measuring Systems
| |
Certification Particle
Size [µm] |
Required Sample
Volume [ft3] |
Required Sample Time
@ 0.1 CFM [min] |
| ISO 3 |
0.2 |
2.98 |
30 |
| 0.3 |
6.92 |
69 |
| 0.5 |
20.18 |
202 |
| ISO 5 |
0.2 |
0.03 |
0.3 |
| 0.5 |
0.20 |
2.0 |
| 1.0 |
0.85 |
8.5 |
The criteria in ISO 14644 Appendix D detail both upper and lower bounds for raw counts as a function of sample time so that dependable pass/fail predictions can be generated in real time.
Additionally, the predictions can be made before collecting the minimum sample volume at each sample point, which is necessary for certification or recertification for sustainment. Figure 3 displays the actual time-dependent pass/fail criteria for an ISO 3 area that is assessed at the 0.2 μm particle size, making it feasible to achieve a final ISO certification in just under 30 minutes (or 0.3 ft3 with the HandiLaz flow rate of @ 0.1 CFM). However, the upper bound on the raw particle counts can signify a pass/fail result way before the collection of the minimum sample volume.
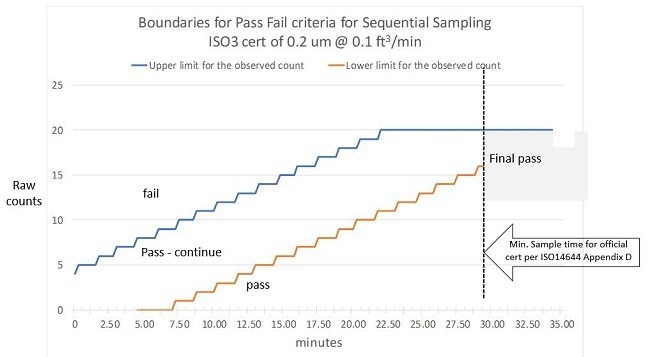
Figure 3. Pass/Fail boundaries for ISO 3 Cert of 0.2 µm @ 0.1 CFM. Image Credit: Particle Measuring Systems
Other Considerations
Along with the time savings, the other key benefits of particle transport and statistical accuracy merit consideration.
For example, if procedures require collecting 1 m3 of airborne particle data and the particle counter samples at 1 CFM, it will take 35.3 minutes to complete. However, there is an increased risk of data variance during this time because other factors can have an impact on data repeatability and negatively influence data integrity:
- Material processes can change.
- Personnel can disrupt/influence air flow patterns.
- Environmental conditions can change.
Conversely, it only takes 10 minutes to collect 1 m3 of airborne particle data when sampling at 100 LPM. This, in turn, provides faster particle capture, higher accuracy and repeatability, and considerably less variance.
These are key considerations because the deviation (s) and mean of the averages (x̅ ) need to be calculated to achieve certain standards. If the data fluctuates widely, the allowable limits for s and x̅ could lead to a failure of cleanroom classification.
Therefore, sampling more air volume offers more data, which results in considerably smaller ratios of standard deviation to the mean value (CV%). A decrease in the ratios leads to improvements in process control limits, which can give users statistical confidence in any cleanroom classification.
Subsequently, higher flow rate particle counters improve effective particle transport through tubing. These counters can acquire more data per unit of time and allow larger particles to pass further through the system, increasing the probability of detection. Particle Measuring Systems has conducted many particle transport studies to verify this information.
One case study included 1-CFM particle counters, 3/8-inch OD sample tubing of varying lengths, and 5.0 μm polystyrene latex spheres (PSL) particle standards. The different tubing lengths were laid out horizontally, and a particle generator nebulized the PSLs. One particle counter-sampled PSLs at the particle generator; the other particle counter-sampled PSLs through the tubing. Particle loss was calculated:
- 45% particle loss (3.0 meters of sample tubing at 1 CFM)
- 59% particle loss (4.5 meters of sample tubing at 1 CFM)
Sample at higher flow rates decreases particle loss. A follow-up study used 100 LPM particle counters, various 3/4-inch OD sample tubing lengths, and 5.0 μm PSLs.
The data showed that larger tubing and higher sample flow rate significantly improves particle transport, reduces particle loss, and enables use of longer sample tubing lengths:
- 41% particle loss (3.0 meters of sample tubing at 100 LPM)
- 42% particle loss (4.5 meters of sample tubing at 100 LPM)
- 44% particle loss (8.0 meters of sample tubing at 100 LPM)
Summary
Sampling at higher flow rates offers quick and easy access to data faster, which means it takes less time to achieve statistical significance. These benefits can reduce labor costs and leave less room for data variability while improving processes.
The final benefit, particle transport, is significantly improved when using higher flow rates. This is particularly significant when analyzing particles larger than 1 μm, as those particles are the most difficult to transport. All of these factors should be considered before purchasing your next particle counter.

This information has been sourced, reviewed and adapted from materials provided by Particle Measuring Systems.
For more information on this source, please visit Particle Measuring Systems.