Particle measurements in ultra-pure water (UPW) systems can take a long time to return to a stable baseline after normal operations are interrupted by an event such as maintenance shutdowns.
A characterization study was conducted to assess how key factors contributed to the stabilization time of measurements in UPW for particles 20 nm and above. It was established that invasive procedures, such as the installation of new sample tubing and components, had a considerable impact on the stabilization time.
On the contrary, non-invasive actions, such as PTFE and PFA valve actuation and the particle counter’s standard warm-up period, had significantly less influence. It was also apparent that by taking distinct measures, such as flushing the new tubing and components and reducing sample tubing lengths, can reduce the particle clean-up time effectively.
Introduction
Modern ultra-pure water (UPW) systems must always be purified to meet the increasingly stringent standards of high-end manufacturing processes. It is not unusual to find particle concentrations in the single-digit particle/ml range or lower for particles larger than 20 nm throughout high-end UPW systems. Monitoring particles in a UPW system is critical to ensuring the particle level stays under the acceptable control limits and does not negatively impact production.
When the level of steady state "baseline" particle reads low, the period needed for particle counts to return to the baseline level can be drawn out. This can lead to major interruptions, impacting the system's regular operation, which includes downtime to perform maintenance or install new components and sample lines.
The stabilization period can take a number of weeks or even months, depending on the size and complexity of the system. Additionally, the high-sensitivity particle counters required to track the particle levels in UPW systems require time to reach a suitable operating temperature after starting up.
During the early warm-up phase, the particle counts given by the particle counter may be temporarily showing increased levels before decreasing to the true level as the instrument reaches thermal stability.
This article outlines the results of an evaluation conducted using an Ultra DI® 20 (UDI-20) Liquid Particle Counter to evaluate the various factors that impact the stabilization time of particle measurements in a UPW system.
Factors tested include the warm-up period after powering on, the effect of disconnecting and reconnecting sample tubes and renewing the flared connection, the clean-up time after installing new sample tubes of various lengths, and the clean-up time after installing a new PFA diaphragm valve.
These findings should help the reader understand why UPW systems can take a significant amount of time to clean up after an interruption and which factors are likely to have the most significant influence.
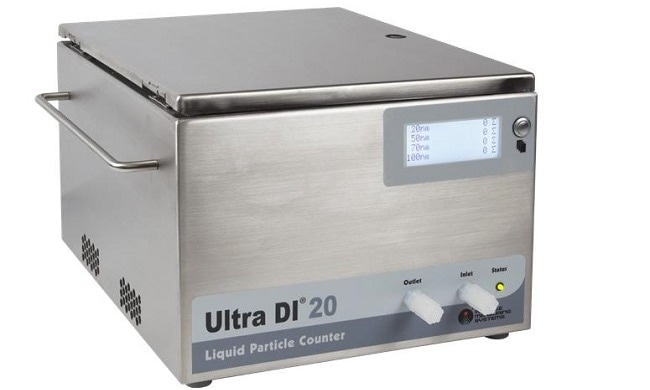
Figure 1. Ultra Di® 20 (UDI 20) Liquid Particle Counter. Image Credit: Particle Measuring Systems
Test Schematic and Description
Figure 2 demonstrates a schematic of the assembly used for the evaluation. The UDI-20 particle counter was attached to the UPW supply with 1/4 inch OD PFA sample tubing. A bubble separator was installed upstream from the UDI-20 as a safeguarding measure to protect the particle counter from any large air bubbles that could enter the system.
A bypass flow controller was placed upstream from the bubble separator to allow flushing of the sample line. A PTFE diaphragm valve which is manually activated was installed at the UPW source to initiate and terminate the flow. The average baseline particle count for particles 20 nm and larger was found to be below 3 particles/ml before the evaluation started.
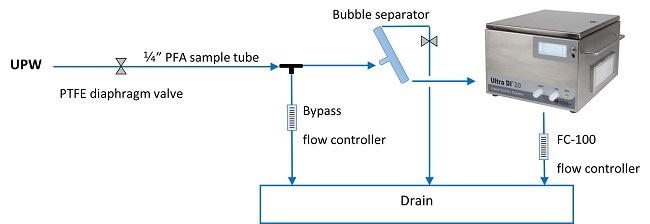
Figure 2. Test Schematic. Image Credit: Particle Measuring Systems
Non-Invasive and Invasive Factors
The term "non-invasive factors" is applied here to describe changes or any actions carried out to update an existing UPW system that does not necessitate replacing or installing new parts. Examples of non-invasive factors include disconnecting and reconnecting sample tubing, power cycling the particle counter, closing and opening valves, and re-flaring existing sample tubing.
The term "invasive factors" refers to the changes made to the system that requires replacing existing parts or installing new parts in the system, such as fitting new sample tubing and/or valves upstream from the particle counter.
Evaluation of Non-Invasive Factors
After powering up high-sensitivity liquid particle counters, such as the UDI-20, the instrument requires time to warm-up and reach a steady-state operating temperature. During this initial warm-up period, it is not unusual for the particle counter to display temporarily elevated particle counts which are a result of the rapid increase of the internal temperature.
Once the instrument has reached its optimum operating level, the particle counts return to the baseline level. The time necessary for the particle count to return to the baseline level (the "stabilization time") was assessed for a UDI-20 after powering on. The test was repeated 3 times; the results are displayed in Figure 3.
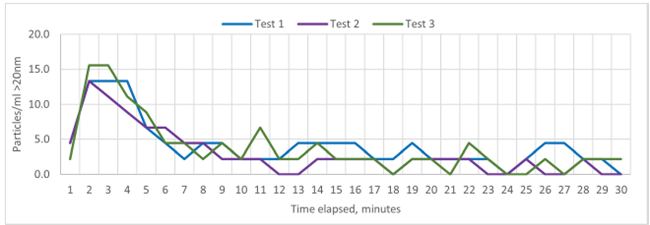
Figure 3. Instrument Stabilization Test Results. Image Credit: Particle Measuring Systems
In each of the three tests, powering on the particle counter resulted in a similar increase in particle counts in the 20 nm channel. However, after around 10 minutes, the particle counts all returned to the baseline level. The actual steady-state operating temperature can differ from instrument to instrument, this means the minimum stabilization time also varies, but this example should be representative of the standard warm-up behavior of a UDI-20 particle counter.
Actuating the Diaphragm Valve
Closing and opening valves in UPW systems can release particles into the UPW as a result of any component movement and frictional forces. Particles may also detach from tubing walls, fittings, filters, and other components as the flow increases after opening a valve, temporarily elevating particle counts.
After actuating the PTFE diaphragm valve, the time needed before particle counts returned to the baseline level (the "clean-up time") was assessed. The results are displayed in Figure 4.
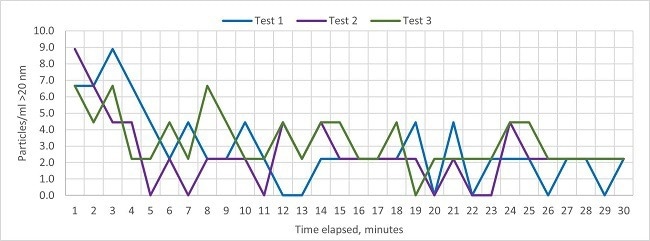
Figure 4. Valve Actuation Test Results. Image Credit: Particle Measuring Systems
As previously, the test was conducted three times.
Immediately after the valve was opened, particle counts increased slightly across all three tests. However, it only took around five minutes for the particle counts to return to the baseline level. It should be noted that the particle cleanliness of different valves would vary significantly depending on the type and condition of the valve.
Particle Measuring Systems has first-hand experience observing that high-quality PTFE and PFA diaphragm valves can be relatively clean during operation.1 Other valve types and low-quality valves may release significantly more particles, resulting in contamination compared to the PTFE diaphragm valve used in this evaluation.
In larger, more intricate UPW systems, more tubing and components are present which could increase the release of particles due to sudden the flow change when valves are actuated, requiring in longer clean-up times.
Disconnecting and Reconnecting Sample Tubing
Particles can be released into the system by simply connecting and disconnecting sample tubing due to frictional forces between surfaces. Particles can also detach from the internal surfaces as the sample tubing and fittings are disturbed.
The clean-up time after the sample tubing was disconnected and reconnected at the UDI-20 inlet was assessed three times, with the results displayed in Figure 5.
\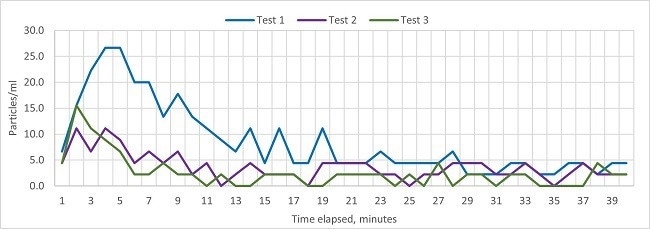
Figure 5. Disconnecting/Reconnecting Tubing Test Results. Image Credit: Particle Measuring Systems
In each of the three tests, an apparent increase in particle counts is observed; the largest increase can be detected after the first disconnection and reconnection of the sample tubing.
The results indicate an increase in particle counts predominantly caused by particles already present in the system becoming detached from internal surfaces when the sample tubing and fittings were disrupted. The contribution from newly introduced particles into the system of test 1 is greater than tests 2 and 3.
The system took around 20 minutes to return to the baseline level following the first test, but after tests 2 and 3 the system only took 10 minutes and 6 minutes, respectively to return to the same levels. It is should be noted the diaphragm valve also required opening and closing during this test also, so a proportion of the detected particles could originate from the valve, as was observed in the previous test.
Flaring the Sample Tube
"Flaring" a sample tube necessitates stretching the end of the sample tube so that it accommodates a flare-shaped fitting with a diameter wider than the tubing. Such flared connections are used frequently throughout the electronics industry. The stress caused by stretching can cause the surface to weaken making it easier for particles to break away.
For this test, the existing flare was separated from the sample tube connecting to the UDI-20 inlet, and a new flare was made with the help of a hand-held flaring tool (Fit-LINE model FT-8). The clean-up time after the flare on the sample tube had been renewed was measured three times, and the results are displayed in Figure 7.
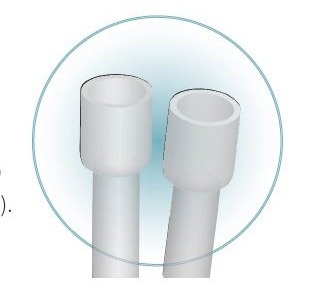
Figure 6. Flared Tubing. Image Credit: Particle Measuring Systems
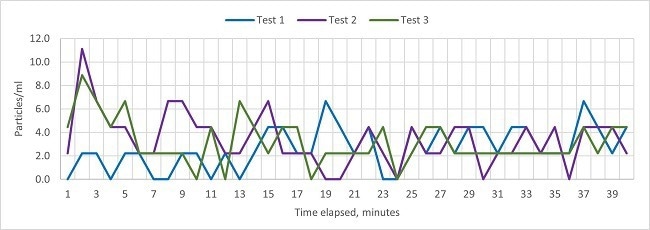
Figure 7. Flaring the Sample Tube Test Results. Image Credit: Particle Measuring Systems
The results from tests 2 and 3, as can be seen in Figure 7, reveal that by flaring the sample tube there was no dramatic increase in particle contamination when compared to simply disconnecting and reconnecting the sample tubing (as displayed in Figure 5).
After approximately 15-16 minutes, the system returned to its baseline level in both cases. However, the particle counts taken from test 1 showed an increase over time and remained consistently above the baseline, suggesting there was a small leak somewhere in the new connection.
Particle Measuring Systems report that such leaks may result in elevated particle counts without any clean sign of leakage. This result demonstrates how key it is that all connections are prepared in the right manner to remain air-tight when working on UPW systems.
The flaring method employed during this evaluation did not necessitate in a heating of the tube to make the material more pliable. The results could show a different outcome if the tube is flared using another method, such as stretching over a mandrel after heating.
Evaluation Results: Invasive Factors
Installing a New Sample Tube
Installing new components into a UPW system can lead to particle contamination which invades the system resulting in extended clean up times. New components, may be contaminated as various manufacturing, packaging, and installation processes for sample tubing and valves can contain large amounts of particle .
The results shown in figure 8 represent how an 80 cm sample tube was replaced by an identical, newly prepared sample tube. The test was repeated three times with three identical sample tubes.
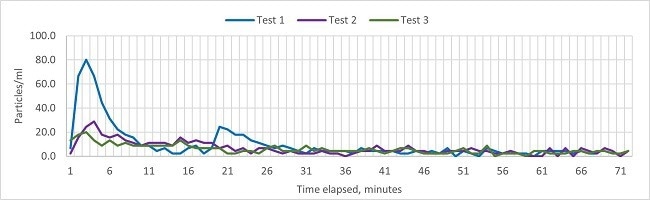
Figure 8. Installing a New Sample Tube Test Results. Image Credit: Particle Measuring Systems
All three tests caused a considerable increase in particle counts that took a relatively long time to clean up. In fact, during the time period over which this evaluation was performed, the system never returned fully to the baseline level. Therefore, the 95% clean-up time was used as an alternative metric, denoting all three tests are similar and require between 65-72 minutes for clean-up.
These results demonstrate that even installing just a relatively short length of new sample tubing can introduce considerable amounts of particle contamination into a UPW system that can take significant amount of time to clean up thoroughly.
Installing a New Sample Tube After Flushing
Flushing the newly installed components and sample lines at a high flow rate is a practical way to reduce the stabilization time of particle measurements of UPW systems.
For this test, the short sample tube between the bubble separator and UDI-20 was switched out for a new 1-meter-long sample tube, and the clean-up time was measured at 95% prior to flushing the tube. Subsequently, the tube was replaced with another identical sample tube, and the 95% clean-up time was once again measured after flushing for 15 seconds.
The flushing was executed by opening the bypass flow controller fully, which allows the flow rate to reach its maximum of approximately 500 ml/min. The results of these tests are displayed in Figure 9 and Figure 10.
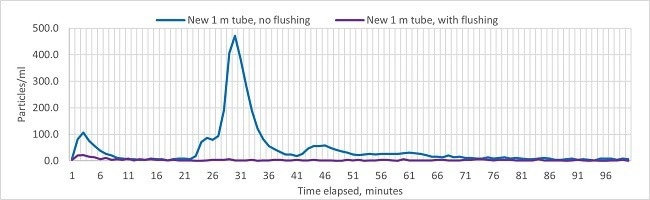
Figure 9. Effect of Flushing After Installing a New Sample Tube (Full Graph). Image Credit: Particle Measuring Systems
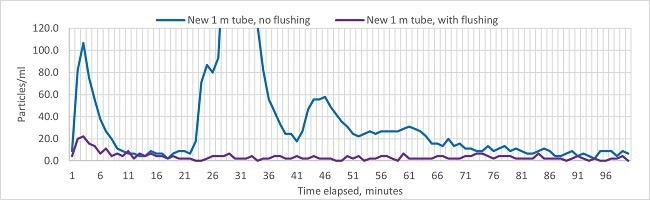
Figure 10. Effect of Flushing After Installing a New Sample Tube (Zoomed In). Image Credit: Particle Measuring Systems
It is clear to see from the comparison in the figures 9 & 10 that flushing the sample tube after installation reduced the clean-up time significantly. Without flushing, there were elevated particle counts that read unstable, and it took around 90 minutes to return to the 95% clean-up level. With flushing, the particle counts were still elevated but much lower, more stable, and took only 25 minutes to return to the 95% clean-up level.
The particle counts post-flushing went back to the baseline level after around 100 minutes. Levels did not bounce back to baseline during the test without flushing, even after sampling for 24 hours.
Effect of Sample Tubing Length
Since there is an increase in the internal surface area of a sample tube in proportion to its length, there is more potential for contamination and the particle contamination has to travel further before the tube is cleared.
It is expected that the longer sample tubes would require a longer clean-up time as more contamination enters the system. For this test, the short sample tube connecting the bubble separator to the UDI-20 inlet was substituted for longer sample tubes with lengths of 3 m, 7 m, and 10 m.
The new sample tubes were flushed for 15 seconds at around 500 ml/min before measurements commenced. Figure 11 outlines a plot of the 95% clean-up time observed against the sample tubing length.
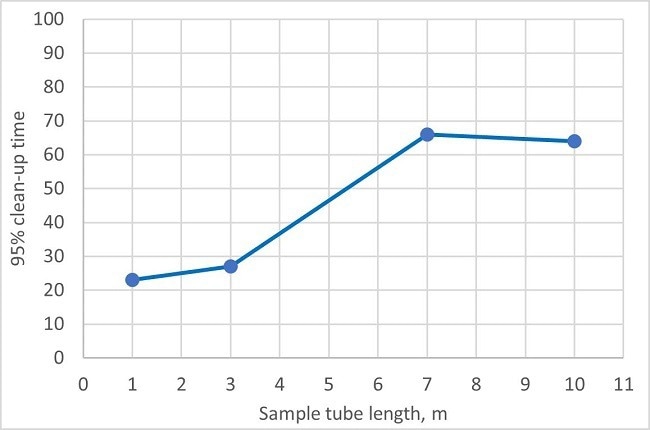
Figure 11. Clean-up Time vs. Sample Tubing Length. Image Credit: Particle Measuring Systems
As expected, the overall trend is to see clean-up times increase in relation to sample tubing length. The clean-up times for the 1 m and 3m sample tubes were between 20-30 minutes, while the 7 m and 10 m sample tubes required 60-70 minutes.
Unexpectedly, the 7 m sample tube took slightly longer to clean up than the 10 m tube, but this is likely because it is not possible to guarantee that all sample tubes are in the same condition at the start of the test.
Despite this outlier, it is clear that sample tubing length has a significant influence on clean-up time.
Installing a New Valve
Installing valves and other active components can lead to a significant release of particles into UPW systems. Even though individual component design may be engineered to be clean as possible during operation, they may contain significant residual particle contamination from the manufacturing and packaging process.
The installation can also introduce particles into the system causing contamination as particles become detached from internal surfaces.
For this test, an additional PFA diaphragm valve was installed upstream from the bubble separator, and the clean-up time was measured after flushing was performed for 15 seconds at approximately 500 ml/min.
A sample tube 80 cm in length was inserted between the bubble separator and the UDI-20 inlet.

Figure 12. Installing a New PFA Valve. Image Credit: Particle Measuring Systems
Figure 10 displays particle counts in the UPW system after the additional valve was installed and opened after flushing for 15 seconds.
Installing the valve introduced a large number of particles into the system. This severity of contamination took several hours to clean up. The 95% clean-up time was measured to be in the region of 270 minutes, and it took around 790 minutes before the particle counts returned to the baseline level.
The clean-up time after a new valve was installed would depend considerably on the type of valve, and the size and the complexity of the UPW system.
This result highlights the effect that the installation of new components can have on the cleanliness of a UPW system over a long period of time.
Data Summary
The results of the characterization are displayed in Tables 1 and 2.
Table 1. Summary of Non-invasive Test Results. Source: Particle Measuring Systems
| |
|
Stabilization Time (minutes) |
| Test Description |
Stabilization Criteria |
Test 1 |
Test 2 |
Test 3 |
| Laser warm-up after powering on the UDI-20 |
Return to baseline |
7 |
10 |
9 |
| Clean-up after valve actuation |
Return to baseline |
5 |
4 |
7 |
| Clean up after disconnecting and reconnecting the sample tube |
Return to baseline |
20 |
10 |
6 |
| Clean-up after renewing flare |
Return to baseline |
>60 (leak) |
16 |
15 |
Table 2. Summary of Invasive Test Results, Installation of New Tube and Valve. Source: Particle Measuring Systems
| |
|
Stabilization Time (minutes) |
| Test Description |
Stabilization Criteria |
Test 1 |
Test 2 |
Test 3 |
| Installation of a new 80 cm sample tube (without flushing) |
95% clean-up |
66 |
72 |
65 |
| Installation of a new valve (flushed for 15 seconds) |
95% clean-up |
271 |
ety |
ety |
| ety |
Return to baseline |
792 |
ety |
ety |
Table 3. Summary of Invasive Test Results, Different Sample Tubing Lengths. Source: Particle Measuring Systems
| Test Description |
Stabilization Criteria |
Tubing length, m |
Flushed for 15 seconds |
Stabilization time (minutes) |
| Clean-up after installation of different sample tube lengths |
Return to baseline |
1 |
No |
Not achieved |
| Yes |
100 |
| 3 |
Yes |
927 |
| 7 |
Yes |
Not achieved |
| 10 |
Yes |
Not achieved |
| 95% clean-up |
1 |
No |
87 |
| Yes |
23 |
| 3 |
Yes |
27 |
| 7 |
Yes |
66 |
| 10 |
Yes |
64 |
Particle Count Stabilization in Real-World UPW Systems
Real-world, high-end UPW systems are considerably larger in scale and much more complex than the small and simple set-up used for this evaluation. As a result, it can take several months for the particle count larger than 20 nm to fully stabilize in these systems due to more invasive factors.2
Figure 13 illustrates the particle counts a semiconductor manufacturer’s plant. These were measured over one month using a UDI-20 installed on a UPW system. In this case, before data collection was initiated, the UPW system had already been online for several months. At the start of the month, the particle count larger than 20 nm was initially in the 2-2.5 particles/ml range.
This value had rescinded by more than 50% by the end of the month and was still trending downwards. However, if only particles larger than 50 nm were being monitored, this system would have appeared to be stable at the beginning of the data collection period. The results demonstrate the importance of having a high-sensitivity particle counter to monitor the quality of the UPW systems.
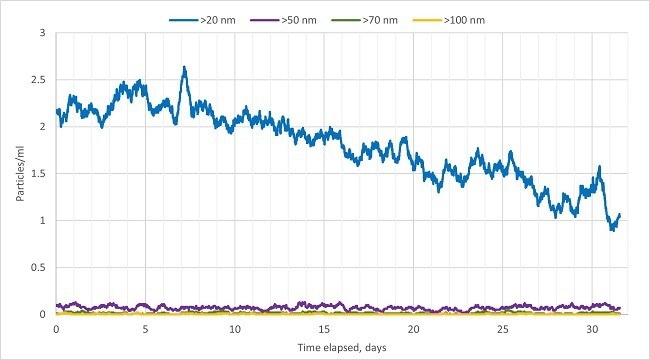
Figure 13. Particle Count Declining in UPW at a Semiconductor Manufacturer During Stabilization. Image Credit: Particle Measuring Systems
Conclusion
Particle measurements can take a long time to stabilize after an interruption to the system's regular operation due to concentrations of ultra-low particles found in high-end UPW systems. This characterization study demonstrates how invasive factors, such as installing new fluid handling components and sample tubing, are liable to significantly impact the stabilization time.
On the contrary, non-invasive factors, such as the actuation of clean operating PFA or PTFE valves and the warm-up period of the particle counter, are likely to have less of a significant impact. Furthermore, it was demonstrated how the particle stabilization time increases as the sample tubing length increases.
While this stabilization period cannot be completely eliminated, measures can be taken to keep it as brief as possible.
If sample lines are kept as short as possible, alongside selecting only clean-operating valves and other components, and performing routine flushing of sample lines it is possible to achieve stable particle measurements in the shortest possible time.
References
- Component Cleanliness Testing for Liquid Systems, PMS Application Note 276 (2018)
- Understanding Nanoparticle Contamination in Ultrapure Water Systems, PMS Application Note 310 (2022)

This information has been sourced, reviewed and adapted from materials provided by Particle Measuring Systems.
For more information on this source, please visit Particle Measuring Systems.