Across the semiconductor industry, ensuring cleanrooms and mini-environments are sufficiently monitored for particle sizes down to 100 nm is a common practice. Most industries have adopted this practice to ensure state-of-the-art factories meet cleanliness standards. There is an increased need to monitor the ambient air as closely as possible to ensure products meet the requirements industry leaders set out to ensure no particles reside at the product interface.
With an increased focus on driving product yield and improving performances, advanced technology nodes have been marked as an area of discussion for in-tool monitoring to limit the number of nanoparticles that can impact yield.
Particle Measuring Systems (PMS) have recently launched the NanoAirTM 10 Condensation Particle Counter which can measure particles down to 10 nm. Furthermore, PMS’s ParticleSeekerTM Smart Manifold system is the latest edition and the first-ever manifold developed specifically for nanoparticle transport. This product will give access to a new world of monitoring possibilities, providing a closer inspection of what the exact requirements and needs are across the industry.
Particle Monitoring Using an Optical Particle Counter (OPC)
Widely accepted, conventional optical particle counters (OPCs) allow particle size detection down to 100 nm with demonstrated success, highlighting the importance of real-time aerosol particle monitoring inside the semiconductor process tools.1
The advantage of real-time particle monitoring within the process tools is the ability to quickly detect particles that may result in yield-impacting defects. These particles are typically found on the product's surface, and there is a significant benefit to having an early warning that raises the alarm of particle events to help minimize or avoid any potential impact on product quality.
Since conventional OPCs only allow particle detection down to 100 nm, there is a growing interest in detecting nano-size particles that could cause degradation of a product’s performance. This call is being answered by the current advancement in new technologies enabling the detection of particles at smaller dimensions.
Introduction to Condensation Particle Counters (CPC)
A condensation particle counter (CPC) is an instrument used to measure the concentration of extremely small particles in a gas media. Typically, the particles to be measured with this technology are smaller than those a normal optical particle counter can measure, due to the constraints of laser technology and sample volumes of particles <100 nm.
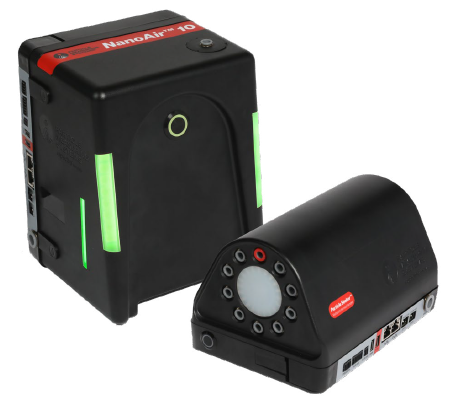
Figure 1. NanoAir™ 10 and Particleseeker™ Instruments. Image Credit: Particle Measuring Systems
CPCs function by growing extremely small particles to a size at which they can be counted by a conventional Optical Particle Counter (OPC). This is done by producing a supersaturated vapor and triggering condensation of the vapor onto the surface of the particles to grow them to a larger size.
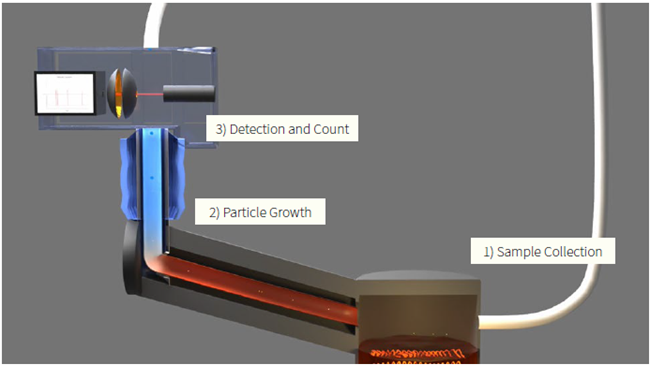
Figure 2. Condensation Particle Counter Diagram. Image Credit: Particle Measuring Systems
Here's How it Works:
- Sample Collection: The CPC pulls a sample of gas-containing particles into the sample inlet. From there, the sampled gas and particles pass into the CPC’s saturator.
- Particle growth: Within the saturator, a working fluid (usually a volatile compound like butanol or alcohol), is heated to the point of evaporation to create a saturated vapor. Next, the sample will be transferred into the condenser. As the sample moves through the condenser, the air is cooled, causing the working fluid to enter a state of supersaturation. This triggers condensation of the working fluid vapor, which settles on the surfaces of the particles, forming liquid droplets around them as the particles grow in size.
- Detection and Counting: Once particle growth is complete, the sample stream passes into a detection chamber, typically containing a light source such as a laser beam. As the expanded particles pass through the detection chamber, they scatter light, which is then detected by an optical detector.
It should be noted that the specific design and operating parameters of a condensation particle counter can vary between manufacturers; they can also differ from model to model, but the fundamental principles described above are common to most CPCs. The NanoAirTM 10 is no exception; however, it uses a cutting-edge design and flow path to make it exceptionally small and compact.
Advantages of Condensation Particle Counters:
- High Sensitivity: CPCs can identify and count extremely small particles (in the size range of a few nanometers to several micrometers). They are uniquely sensitive instruments that enable accurate measurements and facilitate the characterization of particles in this size range. The NanoAir 10 CPC can detect particles down to 10 nm.
- Real-Time Monitoring: CPCs offer the capacity to take real-time measurements, allowing continuous monitoring of particle concentrations. This is especially valuable in applications where instant feedback on particle levels is key for maintaining air quality or ensuring process control. NanoAir 10 units are able to take readings every 0.1 seconds.
- Additional Sizing information: High-sensitivity CPCs like the NanoAir 10 can be used in combination with conventional OPC instruments to supply more information on particle size distributions. Particle size distributions can differentiate between nano-size particles (~10 nm) in a ratio against larger-size particles (>100 nm) to give a deeper insight into determining the source of specific particles, monitoring trends, and assessing particle removal efficiency.
Limitations of Condensation Particle Counters:
• Size range Limitation: CPCs are single-channel instruments, meaning they usually only have one output: total particles. Other particle counters, like OPCs, can usually distinguish between the different particle sizes present in the sample. All particles in a CPC are cultivated to be similar, meaning it is impossible to define their original size after the growth process.
Nanoparticle Monitoring Applications
Case Study 1: Monitoring at 10 nm in a Wafer Alignment Tool
The wafer alignment tool facilitates the precise alignment of wafers before initiating etching, deposition, and patterning processes. Any sudden particle-related problems during this stage can cause defects in the patterned features and harm final quality and yield. Using NanoAir 10 and ParticleSeeker instruments, a comparative evaluation was run between two different wafer alignment tools with and without Fan Filter Unit (FFU) configuration.
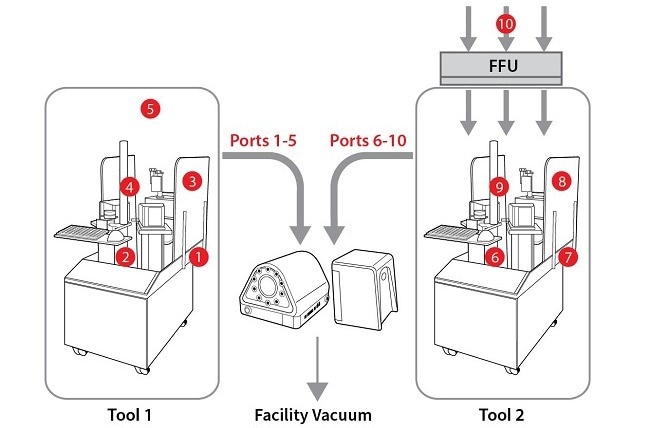
Figure 3. Wafer Alignment Tools (With/Without FFU) Measured Using Nanoair 10 and Particleseeker Units. Image Credit: Particle Measuring Systems
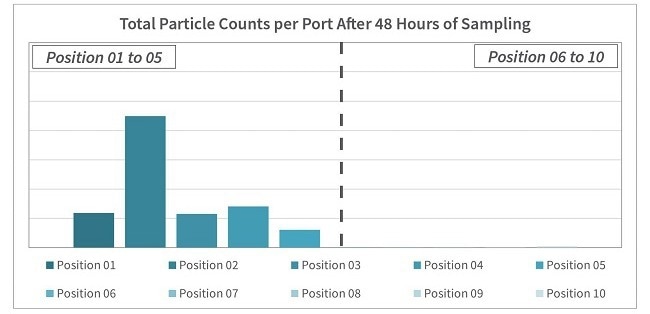
Figure 4. Particle Monitoring at Wafer Alignment Tools (Tool 1 vs Tool 2). Image Credit: Particle Measuring Systems
As can be seen in the test results shown in Figure 4, Tool 1 detected significantly more particles (in positions 01 to 06), which revealed that the FFU is effective at maintaining particle cleanliness within the wafer alignment tool. Significant particle events were detected in Tool 1 at port 2 close to the wafer loading area – as illustrated in Figure 3. In-tool particle monitoring with a manifold can distinguish between clean and dirty operating tools and pinpoint contamination sources with real-time data for comparison.
Case Study 2: Monitoring at 10 nm in a Wafer Inspection System
Most semiconductor factories commonly use highly sensitive tools for wafer surface inspection to identify particles and defects. Usually, within the wafer inspection system, each wafer passes from the Front Opening Unified Pod (FOUP) at the loading port to the pre-aligner by the wafer robot before being transferred to the wafer inspection scanner. During this workflow, the wafer can be vulnerable to particle contamination when exposed to the tool, giving rise to false detections and non-detection of actual defects.
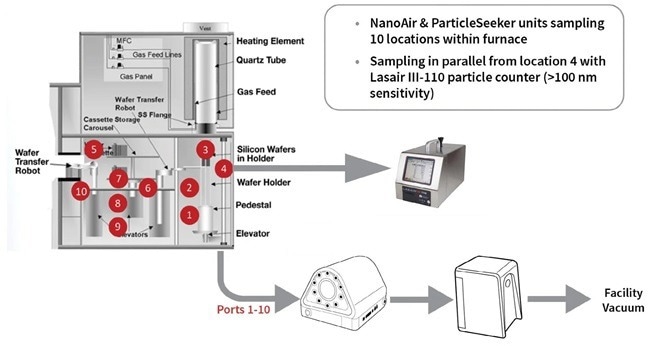
Figure 5. Wafer Inspection System Measured Using NanoAir 10 and Particleseeker Units. Image Credit: Particle Measuring Systems
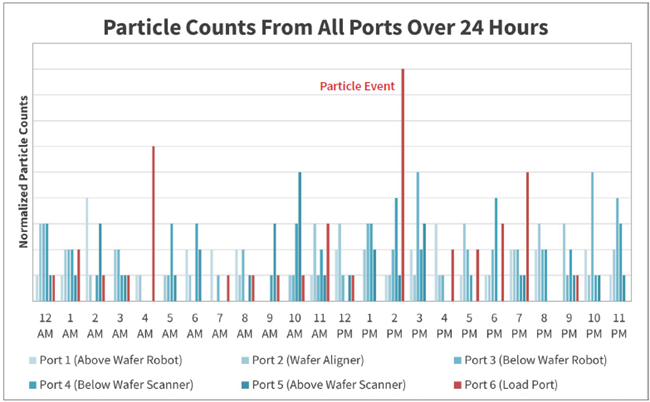
Figure 6. Particle Monitoring Over 24 Hours at the Wafer Inspection System. Image Credit: Particle Measuring Systems
As shown in Figure 6, over the 24 hours of data collection at the wafer inspection system, one particle event (particle counts outside of the 3σ range) was detected at Port 6. Port 6 is positioned close to the FOUP loading dock (as displayed in Figure 5), which, in all likelihood, has the greatest risk of particles entering from the external ambient air into the wafer inspection system.
The movement of the FOUP docking paired with the opening of the FOUP enables the exchange of ambient airflow due to pressure differences. This could have aroused particles and created particle events during wafer transfer. Real-time data could offer a deeper insight into how to monitor key locations within the system to ensure the highest degree of cleanliness is achieved to minimize and prevent particles from being deposited onto the wafer surface.
Case Study 3: Monitoring at 10 nm in a Wafer Sorting Tool
The wafer sorting tool is used to sort and test the quality of processed wafers and is considered one of the most vital tools in semiconductor manufacturing. During the sorting process, wafers are transferred in and out of the FOUP by a wafer robot and pass through each stage or location of the sorting tool for sorting and testing.
Once the wafers have passed through the FOUP, which is the mini-environment, they could suddenly be exposed to particle contamination that can give rise to potential defects later in the manufacturing process. In the following test, NanoAir 10 and ParticleSeeker instruments were employed to sample 10 different location points across the tool (as illustrated in Figure 7) to understand the particle performance.
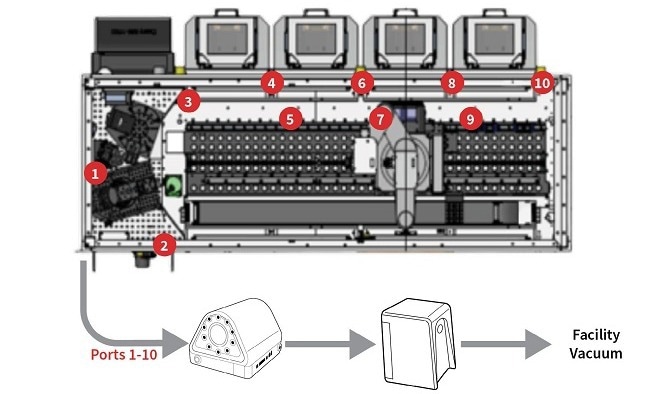
Figure 7. Wafer Sorting Tool Measured Using Nanoair 10 and Particleseeker Unit. Image Credit: Particle Measuring Systems
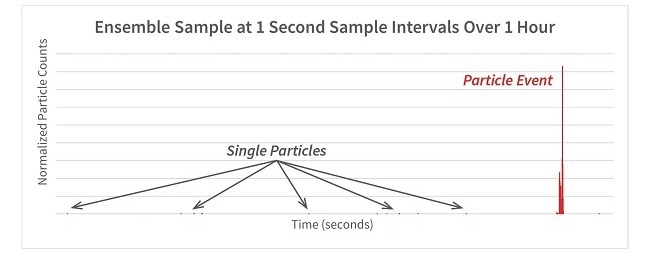
Figure 8. Graph of Particle Monitoring at the Wafer Sorting Tool. Image Credit: Particle Measuring Systems
The results displayed in Figure 8 reveal the results of the NanoAir and ParticleSeeker units sampling in ensemble mode with 1-second intervals per port for rapid detection of excursions. The wafer sorting tool is typically clean, but the single recorded particle event appeared when the FOUP doors were opened.
The potential reason for the particle event could be related to airflow exchange and the interaction with the external ambient air when the FOUP doors were opened. Real-time, in-tool monitoring with a manifold in ensemble mode enables fast detection of excursions throughout the wafer sorting tool's key points, generally the locations where the wafers are close to it.
Case Study 4: Monitoring at 10 nm in a Vertical Diffusion Furnace
The diffusion process is considered one of the key steps in semiconductor manufacturing. Usually, batches of wafers are placed into a furnace, and thin films are deposited onto the wafer surface via diffusion of a dopant gas at high temperatures.
Throughout this process, from moving the wafers to the silicon wafers holder until the wafers are loaded into the furnace, any particle contamination can severely impact the quality and integrity of the deposited films on the wafer surface. To better understand the particle performance, NanoAir 10 and ParticleSeeker instruments were used to sample 10 different locations within the diffusion tool right before the furnace, as shown in Figure 9.
Figure 9. Vertical Diffusion Furnace Measured Using NanoAir 10 and Particleseeker Units. Image Credit: Particle Measuring Systems
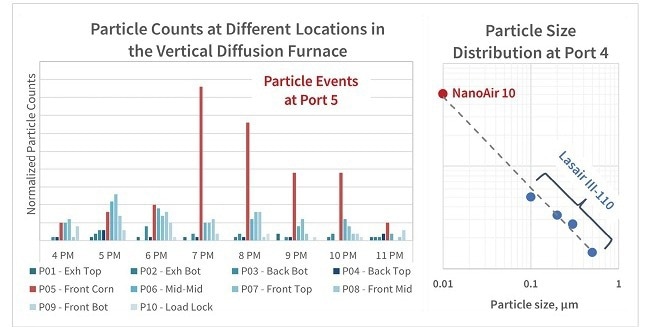
Figure 10. Particle Monitoring at Vertical Diffusion Furnace. Image Credit: Particle Measuring Systems
This vertical diffusion furnace tool was selected for the study due to its known history of problematic particle contaminations. The issue encountered was that the existing monitoring configuration, consisting of only the Lasair® III-110 particle counter, could only sample a single location and could, therefore, not see differences between locations. This meant it could not pinpoint where the particle source was being generated.
As displayed in Figure 10 (particularly the graph to the left), the NanoAir 10 and ParticleSeeker instruments were used for real-time particle monitoring inside the tool by using the manifold to sample at several locations within the furnace. This enabled the discovery and isolation of intermittent contamination sources. The source of the particle contaminations was discovered at Port 5 (front corner, as shown in Figure 9). Moreover, the particle size data (>10 nm) from the NanoAir 10 unit corresponds well with data from the Lasair III-110 particle counter and follows a normal logarithmic distribution curve, as illustrated in the right-hand graph in Figure 10.
Case Study 5: Monitoring at 10 nm in Front Opening unified Pod (FOuP) Purge System
A Front Opening Unified Pod (FOUP) purge system, as shown in Figure 11, shares a concept similar to the wafer transport carrier’s particle monitoring tool; as well as monitoring the particles, it also acts as a purging facility for the FOUP.
The FOUP purge system uses extremely pure nitrogen gas to purge used or “dirty” FOUPs and ensure the air meets its cleanliness level before the FOUP can be placed back in the production line. Simultaneously, the purge system can determine FOUPs that are terribly “dirty” with unusually high particle levels that require immediate attention. Experiments were conducted to understand the nanoparticle performance using a NanoAir 10 instrument.
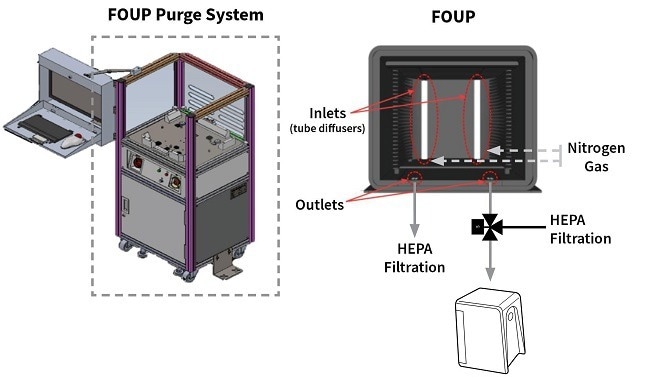
Figure 11. FOUP Purge System Using NanoAir 10 Instrument. Image Credit: Particle Measuring Systems
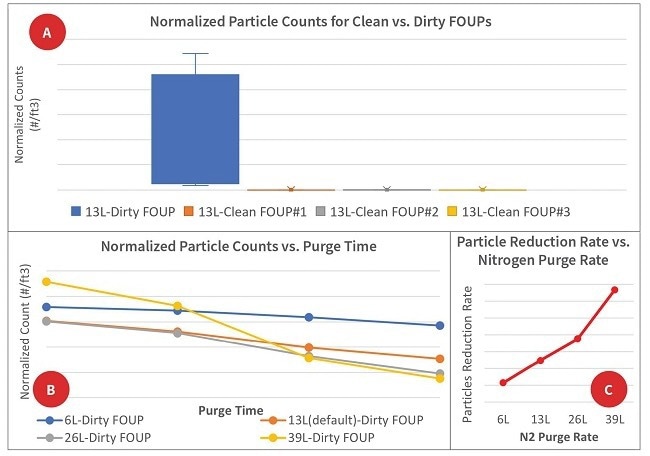
Figure 12. Graphs of Data Collected From Particle Monitoring in Clean and Dirty FOUPs. Image Credit: Particle Measuring Systems
From the test results shown in graph A in Figure 12, it was discerned that with a standard nitrogen purge flow rate at 13 L, there was a considerable difference in nanoparticle performance between clean and dirty FOUPs. To evaluate the optimal nitrogen purge flow and efficiency in cleaning up a dirty FOUP, various nitrogen flow rates were set up (6 L, 13 L, 26 L & 39 L), and the particle reduction rate was the greatest with a flow rate of 39 L as illustrated in graph C.
Moreover, graph B outlines the normalized particle counts the NanoAir acquitted at each purge rate over time. Real-time monitoring data can offer significant insights into optimizing the right flow rate in the fastest time possible, detecting particles larger than 10 nm, and validating the desirable level of FOUP cleanliness.
Summary
Conventional particle monitoring methods can be laborious and time-intensive to install and operate and can usually only provide data over a time delay. Controlling particle contamination within process tools is critical for reducing the impact on quality and yield, and the NanoAir 10 and ParticleSeeker instruments are well-positioned to assist in this matter.
This article presented five case studies demonstrating how important real-time monitoring inside tools can be when using the ParticleSeeker manifold. This system allows ensemble or sequential sampling modes to monitor and track the overall tool cleanliness or evaluate specific locations to detect particle size as small as 10 nm and particle excursions.
Particle monitoring with the NanoAir and ParticleSeeker offers real-time results and feedback, facilitating identifying and mitigating problematic particle sources such as faulty robot arms and other moving parts, poorly or non-functioning Fan Filter Units (FFUs), or exhaust.
Cross-particle contamination is generally a problem caused by ingress and exchange of airflow from loading areas, hatches, and FOUP dockings. The instantaneous access to data in these hard-to-reach areas that the NanoAir 10 and ParticleSeeker units provide can be extremely beneficial for reducing risk and costs. Real-time, in-tool particle monitoring using these instruments can help mitigate yield impacts while reducing time and labor costs.
Reference
- Real-Time Aerosol Particle Monitoring Inside of Semiconductor Process Tools Using the Airnet® II Particle Counter, Application Note, Particle Measuring Systems (2023).

This information has been sourced, reviewed and adapted from materials provided by Particle Measuring Systems.
For more information on this source, please visit Particle Measuring Systems.