One of the questions that typically echoes around tradeshows and conferences is how a Nanalysis instrument compares to high-field data. There are considerable intrinsic differences between low-field and high-field instruments. However, sensitivity (S/N) and resonance dispersion (signal separation) are considered the most important from a chemistry point of view.
- Sensitivity: The signal-to-noise ratio (S/N) corresponds to the formula in Figure 1. For the same sample obtained at 60 vs. 400 MHz, the theoretical SNR ratio is 17.2, and vs. 600 MHz, it is 31.6.
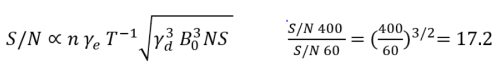
Figure 1. n: # Nuclei in resonance; γe : Gyromagnetic ratio of excited nuclei; T: Temperature of the sample (K); γd : Gyromagnetic ratio of detected nuclei; B0 : Applied field strength (T); NS : Number of scans. Image Credit: Nanalysis Corp.
- Resonance dispersion: After data acquisition, Fourier transformation converts FID from the time domain to the frequency domain. The frequency (in Hz) is relative to the strength of the external field. Since it is common to use spectrometers with different magnetic field strengths, the decision was made to express the chemical shifts using an independent unit (ppm), as displayed in Figure 2. As more Hz/ppm are present at 400 MHz, and the couplings stay constant, the signals are better resolved and appear narrower than they are at 60 MHz even though it can be observed that each signal contains the same structural information.
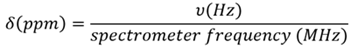
Figure 2. PPM scale calculation. Image Credit: Nanalysis Corp.
Herein, spectra acquired at 60, 400 and 600 MHz are shown to illustrate the impact of sensitivity and signal dispersion. Figure 3 displays the proton NMR spectra of 4-hydroxypropiophenone at 250 mM concentration obtained at various field strengths. It is impossible to see a major difference in S/N using the naked eye between the spectra at 400 and 600 MHz, but a clear difference is observed when comparing them with the spectrum at 60 MHz.
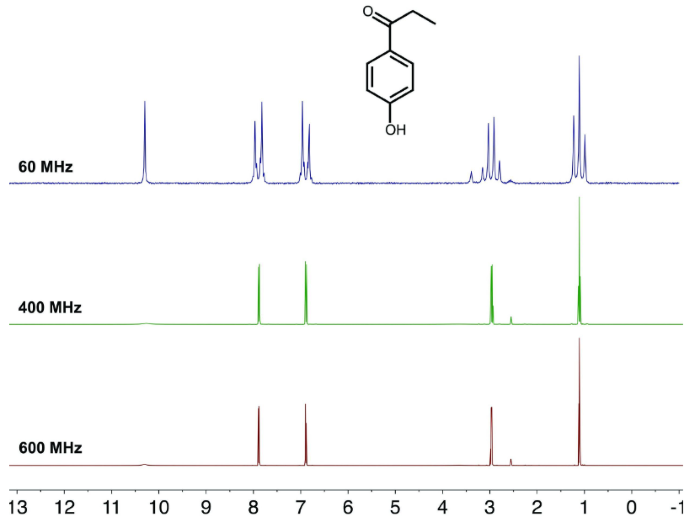
Figure 3. Spectra acquired at 60, 400 and 600 MHz. Image Credit: Nanalysis Corp.
Figure 3 focuses on specific regions to compare the difference in signal dispersion (see also Figure 4). Each resonances centers at the same chemical shift, but the signals at 400 and 600 MHz are considerably narrower.
The difference in signal dispersion when contrasting 400 and 600 MHz spectra is not considered major because the field is only 1.5 times stronger. However, the field strengths at 400 and 600 MHz are almost seven times and 10 times stronger, respectively.
The key point to highlight here is that despite the main difference in signal dispersion, the spectra obtained across various field strengths contain the same chemical and structural information.
Close attention should be paid to the aromatic doublet shown in Figure 4; it reveals that the same splitting pattern occurs in all the fields.
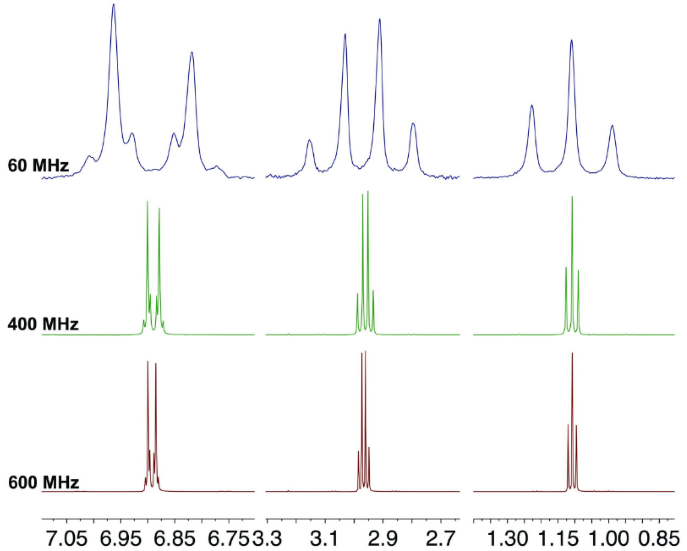
Figure 4. Spectra acquired at 60, 400 and 600 MHz. Image Credit: Nanalysis Corp.
While it can be beneficial to observe the sharp spectra generated using high-field instruments, most of the time, the spectra can be analyzed using a low-field instrument, affording significant savings in both cost and time.

This information has been sourced, reviewed and adapted from materials provided by Nanalysis Corp.
For more information on this source, please visit Nanalysis Corp.