Nuclear magnetic resonance (NMR) is an information-rich technique. However, it requires a higher analyte concentration than all other spectroscopic methods, especially when compared to analytical techniques such as UV-Vis. The analyte concentration required for UV-Vis is only nM to µM, while NMR requires an analyte concentration in the mM range, which is >1000 times more concentrated.
This article will discuss and demonstrate why NMR is far less sensitive than UV-Vis. UV-Vis was chosen for this comparison as it is considered one of the most sensitive spectroscopic techniques.
The signal frequency observed in both spectroscopic methods can be associated with the difference in population between the two energy states. The energy difference (ΔE) corresponds with Planck’s constant (h) as a multiple of the frequency (ν), as shown in Equation 1.
In NMR, a half-rotation in the presence of a magnetic field will bring about two spin states (α and β), where the variance in energy between the two spin states will deviate based on the magnetic field strength (Bo) and the nucleus gyromagnetic ratio (γ), as displayed in Equation 2. Conversely, in UV-Vis, the energy variation between the ground and excited states will be contingent on the wavelength of absorption (λ), as shown in Equation 3.
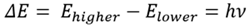 |
Equation 1 |
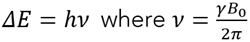 |
Equation 2 |
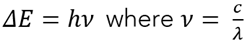 |
Equation 3 |
The ΔE can be determined by solving Equations 2 and 3 using the values shown in Table 1. The energy difference calculated between the α and β states for 1H at 400 MHz is 2.65*10-25 J, while the ΔE between the ground state and the excited state for the electronic transition, taking into account a wavelength of 500 nm, is 3.98*10-19 J.
To offer further context, if the energy difference for the UV-Vis system were comparable to the length of a soccer field (~125 m), the NMR system’s energy difference would be the thickness of a human hair (~80 µm). The thermal energy of Nanalysis’s system at 25 ºC (kB*T) is equivalent to 4.11*10-21 J, as shown in Equation 4. Therefore, while in NMR, the ΔE is somewhere in the region of 15,000 times lower than the thermal energy, in UV-vis, the ΔE is 100 times greater than the thermal energy.
The subsequent step is determining the population difference between the two states, but before running this calculation, it is obvious that in NMR, the spins will be spread out over the two levels more evenly, while in UV-Vis, all molecules will essentially be in the ground state.
The Boltzmann distribution establishes the difference in population between the two energy levels previously calculated (see Equation 4).
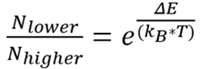 |
Equation 4 |
For UV-Vis, around 100 % of molecules will be in the ground state, which is owed to the population ratio between the ground and excited states being 1*1042. However, for NMR, the population ratio between the levels is 1.000064, implying that the lower level (α) only has an exceptionally small population excess (50.0016 %).
This can be visualized by assuming one million ‘species’ in NMR (spins); thus, 500,016 species would be observed in the α state and 499,984 in the β state. However, around 1,000,000 species in UV-Vis would be observed in the ground state and 0 in the excited state.
Therefore, the population excess for NMR is only 32, while in UV-Vis, it is 1,000,000. This difference in population contributes to sensitivity, which reveals why NMR has intrinsically low sensitivity in contrast to other analytical techniques, such as UV-Vis.
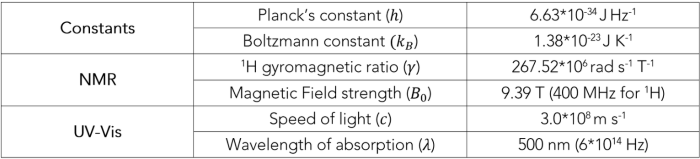
Table 1: Values used to calculate energy variation and population ratio. Source: Nanalysis Corp.
Despite its low sensitivity compared with other analytical techniques, NMR remains one of the most powerful characterization techniques available. It is intrinsically quantitative and non-destructive, and unlike other methods, it can generate highly detailed information regarding molecular structure.
References and Further Reading
- Larive, C. K. and Korir, A. K. Topic 1.3: How does the population difference in NMR compare to the difference between electronic ground and excited states? in Quantitative NMR. It is an open book and can be accessed here.
- Claridge, Timothy D. W., High-Resolution NMR Techniques in Organic Chemistry, 2nd edition, chapter 2, pp. 11-13.
- https://physics.nist.gov/cuu/Constants/index.html (accessed December 2022).

This information has been sourced, reviewed and adapted from materials provided by Nanalysis Corp.
For more information on this source, please visit Nanalysis Corp.