In recent years, microplastics have emerged as a significant concern for environmental health and safety, with their long-term impacts still not fully understood. Defined as plastic particles smaller than 5 mm, microplastics are now recognized as the most prevalent form of marine debris.1,2
Microplastics are divided into two categories: primary, including small, manufactured items such as fibers and beads, and secondary, including fragments formed by a combination of physical, biological, and chemical processes.3
Research laboratories must enhance their capabilities to routinely analyze microplastic candidates from environmental samples. Spectroscopic techniques, in particular, are well-suited for polymer identification, aiding in the determination of the origin of microplastics and helping to predict their biological impacts.
Laboratory Raman spectroscopy is an alternative to confocal Raman microscopes and Fourier transform infrared (FTIR) microscopes, allowing for rapid identification of polymer materials. However, traditional Raman analysis performs poorly on very small samples.
In the study discussed in this article, portable Raman microscopy was employed to identify very small microplastic particles recovered from surface estuary waters.
Raman Analysis of Microplastics
Raman spectroscopy offers numerous advantages and can be adapted for various applications. Compared to FTIR, another common technique for identifying microplastics, Raman microscopy facilitates easier sampling of small particles (<100 μm). Additionally, Raman systems are generally more portable than most other techniques, enabling on-site testing.
Despite some interference from dyes, polymers and plastics are well-suited for Raman analysis. Figure 1 illustrates the Raman spectra of bulk polyethylene and polypropylene materials measured using 1064 nm excitation, where the plastics can be clearly differentiated by their distinct spectral features.
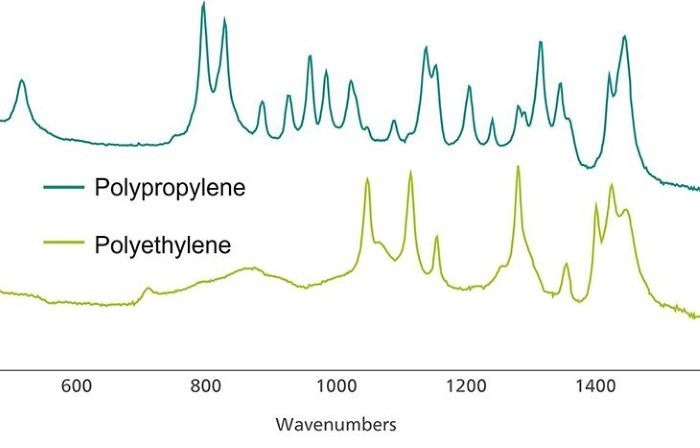
Figure 1. Raman spectra of polypropylene (top) and polyethylene (bottom). Spectra are manually offset for visual clarification. Image Credit: Metrohm Middle East FZC
Experimental Details
Water samples were collected from the surface of Delaware Bay, US, and transferred to glass jars, where they were fixed with 4 % formaldehyde. The samples were then size-fractioned using stainless steel sieves with mesh sizes of 5000, 1000, and 300 μm.
The 300 and 1000 μm fractions were dried overnight at 90 °C. Following drying, microplastics were separated from digested organic material through wet peroxide oxidation and density separation processes.4
Microplastics were then collected onto 200 μm Nitex mesh and dried. These samples were examined under a stereomicroscope, where each piece was classified by type—such as fragment, fiber, bead, film, foam, or rubber. Raman spectroscopy was subsequently used for plastic identification.
Table 1. Experimental parameters. Source: Metrohm Middle East FZC
| Equipment |
Acquisition settings |
| i-Raman EX |
Laser Power |
<165 mW |
| BAC151 video microscope |
Int. time |
30 s–3 min |
| BWID software |
Average |
1 |
All measurements were conducted using an i-Raman® EX portable Raman system with 1064 nm laser excitation, as detailed in Table 1. The 1064 nm laser excitation reduced spectral fluorescence, which can occur with 785 nm laser excitation in colored microplastic samples.
For imaging the microplastics, a BAC151C video microscope with a 50x magnification objective lens (9.15 mm working distance, 42 μm spot size) was used. To prevent sample burning, laser power was kept below 50 % of the maximum (< 165 mW). Microplastics were identified using BWID® software, which compared the samples to a reference library of plastic spectra.
Secondary Microplastics
Figure 2a shows a blue microplastic fragment, one of the many samples studied, with a diameter near the upper end of the microplastic size range (approximately 4.5 mm). The irregular shape suggests that this sample is likely a secondary microplastic. Figure 2b presents the Raman spectrum collected from the blue plastic fragment.
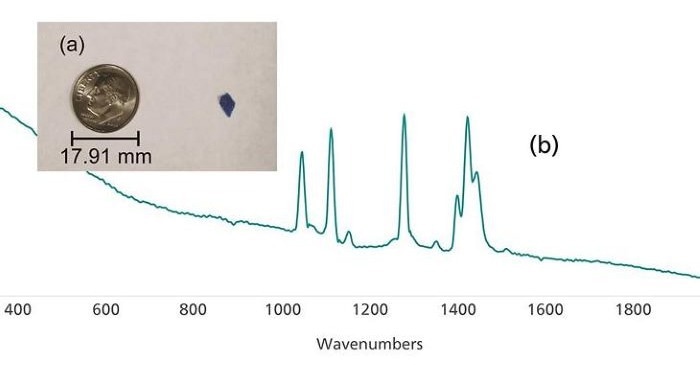
Figure 2. (a) Small blue plastic fragment (with American dime for comparison) and (b) Raman spectrum acquired from the sample. Image Credit: Metrohm Middle East FZC
The BWID software was used to compare the acquired spectrum of an unknown sample to a reference library, generating a hit quality index (HQI), which served as a correlation coefficient.
The calculation applied the first derivative to the spectrum. Spectral library search results are ranked on an HQI scale from 100 to 0, with 100 representing the best match. BWID is compatible with various commercial spectral libraries and also supports the creation of custom libraries.
In this analysis, BWID matched the blue fragment in Figure 2a to a reference spectrum of polyethylene (PE) with a calculated HQI of 95.7, as shown in Figure 3, indicating a strong spectral correlation.
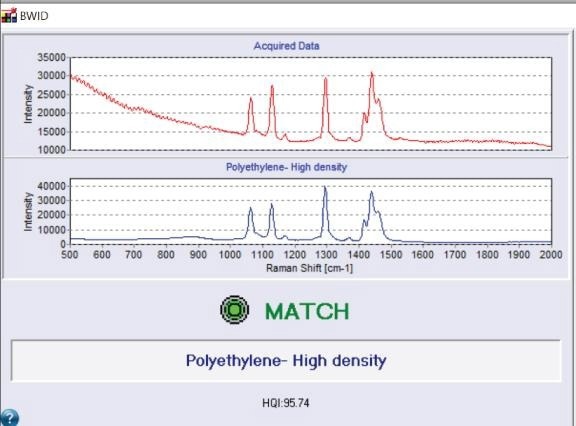
Figure 3. BWID match for polyethylene. Image Credit: Metrohm Middle East FZC
Primary Microplastics
Figure 4a displays the Raman spectrum attained from a small, spherical bead (likely a primary microplastic), pictured in Figure 4b. BWID matched the sample spectrum to a reference spectrum of polystyrene with an HQI of 98.2.
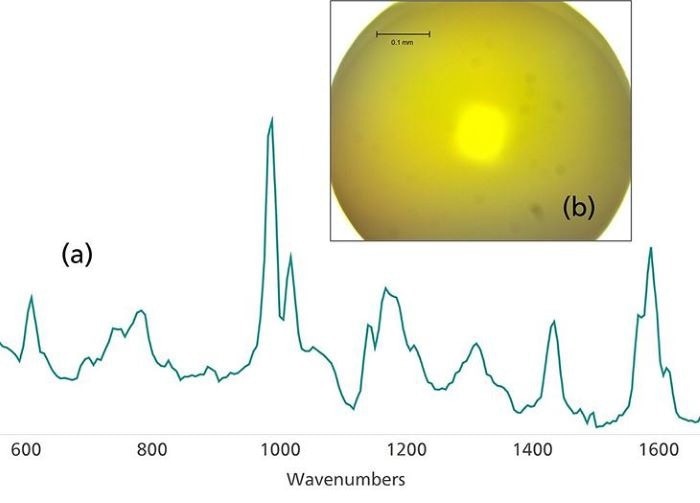
Figure 4. (a) Raman spectrum of polystyrene collected from (b) a polystyrene bead. Image Credit: Metrohm Middle East FZC
Fibers are an important and common subgroup of microplastic particles. Figure 5a displays the Raman spectrum attained from a thin colored fiber, shown in Figure 5b. BWID matched the corresponding Raman spectrum to a reference spectrum of polypropylene, with a calculated HQI of 74.9.
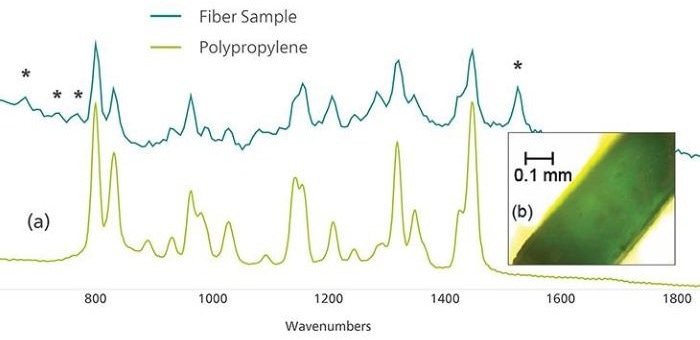
Figure 5. (a) Raman spectra of a colored fiber (top) compared to a reference spectrum of polypropylene (bottom) and (b) microscope image of the colored fiber. The asterisks denote peaks that can be attributed to the colorant used in the plastic. Image Credit: Metrohm Middle East FZC
This relatively low value prompted further investigation into peaks in the sample spectrum that could not be attributed to polypropylene.
The peak at approximately 1537 cm-1 and the set of weak peaks from 670–790 cm-1 were in line with the Raman spectrum of chlorinated copper phthalocyanine green pigment, useful information for determining the origin of a sample.5
Summary and Technique Limitations
A summary of the microplastics analyzed in this study reveals that the samples were predominantly composed of polyethylene, polypropylene, or polystyrene (Table 2). Black microplastics, which have historically posed challenges for Raman analysis, were more likely to yield inconclusive results.
Sample degradation is another noted limitation. To prevent distortion and burning, low laser powers (~10 % of maximum) should be used during analysis.
Table 2. Summary of identification results. Source: Metrohm Middle East FZC
| Match Result |
Number of samples |
| Polyethylene |
11 |
| Polypropylene |
4 |
| Polystyrene |
2 |
| Inconclusive |
5 |
Conclusions
Microplastics pose a potential threat to both human health and the environment, making their thorough characterization an increasingly important research focus. Raman microscopy is a powerful tool for the precise identification of these microplastics.
Using 1064 nm excitation helps to reduce fluorescence from dyes present in the plastics, improving the accuracy of analysis. Additionally, software-based correlation coefficient algorithms facilitate the straightforward identification of plastic materials.
Acknowledgments
Produced from materials originally authored by Jonathan H. Cohen and Taylor Hoffman from the University of Delaware School of Marine Science and Policy.
References and Further Reading
- Law, K. L. (2017). Plastics in the Marine Environment. Ann Rev Mar Sci, 9, pp.205–229. https://doi.org/10.1146/annurev-marine-010816-060409.
- Galloway, T. S., Cole, M., Lewis, C. (2017). Interactions of Microplastic Debris throughout the Marine Ecosystem. Nat Ecol. Evol., 1(5), 116. https://doi.org/10.1038/s41559-017-0116.
- Jambeck, J. R., Geyer, R., Wilcox, C., et al. Plastic Waste Inputs from Land into the Ocean. Science, 347(6223), pp.768–771. https://doi.org/10.1126/science.1260352.
- Masura, J., Baker, J., Foster, G., et al. (2015). Laboratory Methods for the Analysis of Microplastics in the Marine Environment: Recommendations for Quantifying Synthetic Particles in Waters and Sediments. NOAA Technical Memorandum, Report NOS-OR&R-48, NOAA Marine Debris Division, Silver Spring, MD. https://doi.org/10.25607/OBP-604.
- Duran, A., Franquelo, M. L., Centeno, M. A., et al. (2011). Forgery Detection on an Arabic Illuminated Manuscript by Micro-Raman and X-Ray Fluorescence Spectroscopy. Journal of Raman Spectroscopy, 42(1), pp.48–55. https://doi.org/10.1002/jrs.2644.

This information has been sourced, reviewed and adapted from materials provided by Metrohm Middle East FZC.
For more information on this source, please visit Metrohm Middle East FZC.