Mixer Testing in the PVC Industry
A laboratory mixer is the best tool for assessing the PVC compositions' fusion behavior, compound stability, and processing behavior. It is extremely sensitive to changes in the compound formulation or changes in the dry blend components, such as resin, additives, and additional fillers.
Laboratory mixers are also susceptible to alterations caused by improper handling. To obtain valid test results, the mixer must be handled in a reproducible manner.
This article contains examples of reproducible mixer tests as well as demonstrations of how changes in testing settings affect measurement findings.
For these studies, the following equipment combination was used:
- Thermo Scientific™ HAAKE™ PolyLab™ OS RheoDrive™ 7 OS
- Torque sensor for HAAKE PolyLab OS, 400 Nm
- PolySoft OS Mixer Test and Data Evaluation Software
- HAAKE Rheomix 600 OS
- Roller rotors
- Pneumatic ram
- Sample material - rigid PVC dry blend (typically used to produce window profiles)
Test Technique and Measurement Outcomes
A typical PVC dry blend consists of basic PVC resin, fillers, processing aids (such as softeners, stabilizers, inner and outer lubricants), and other additives. Each component determines the compound's processing behavior. One crucial component is fusion behavior.
Changes in fusion behavior directly impact the degree of gelation in the final product. For a PVC window profile, this might result in deterioration of mechanical qualities or welding issues.
Unlike other thermoplastic polymers, PVC does not melt when exposed to higher temperatures. PVC requires additional shearing and compression pressures to agglomerate its particles and form a homogeneous melt.
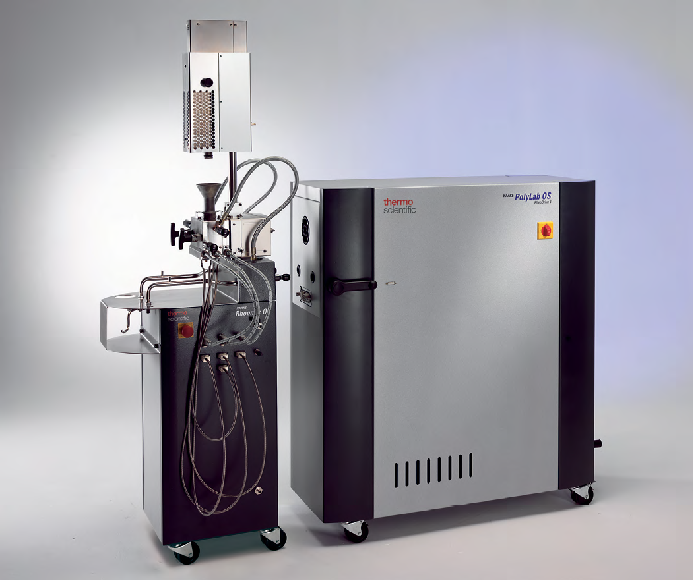
Figure 1. HAAKE PolyLab OS System - RheoDrive with Rheomix OS Laboratory Mixer. Image Credit: Thermo Fisher Scientific – Materials Characterization
In a laboratory mixer, this fusion behavior can be investigated by measuring the drive torque and recording it over time.
The PolySoft OS Mixer Test and Data Evaluation Software (Figure 2) walks the user through the test, takes the measurement data, and assesses all points of interest on the resulting measurement curve using dedicated, predefined evaluation methods.
This software also functions as a measurement database, allowing for additional statistical investigations to be performed. Figure 3 depicts an examination of a torque curve. At the start of the test, adding the PVC powder into the mixer induces an instantaneous rise in torque ("L"-adding Peak).
The powder is subsequently distributed throughout the mixer chamber, and some elements of the compound (such as waxes) melt due to the high mixer temperature. Both effects result in a reduction in torque and a first minimum ("V"-Valley).
Due to the increased mass temperature and shear energy, the PVC begins to mix into larger agglomerates. This increases viscosity, which in turn increases torque. This process produces a second torque maximum ("F" - Fusion Maximum).
The PVC dry blend creates a homogenous melt. The torque lowers again as the sample temperature rises due to frictional heating until it achieves a constant value.
The temperature increase generated by dissipation is balanced with the temperature drop caused by heat conduction through the chamber wall. The torque being adjusted here represents the sample's melt viscosity in relative terms.
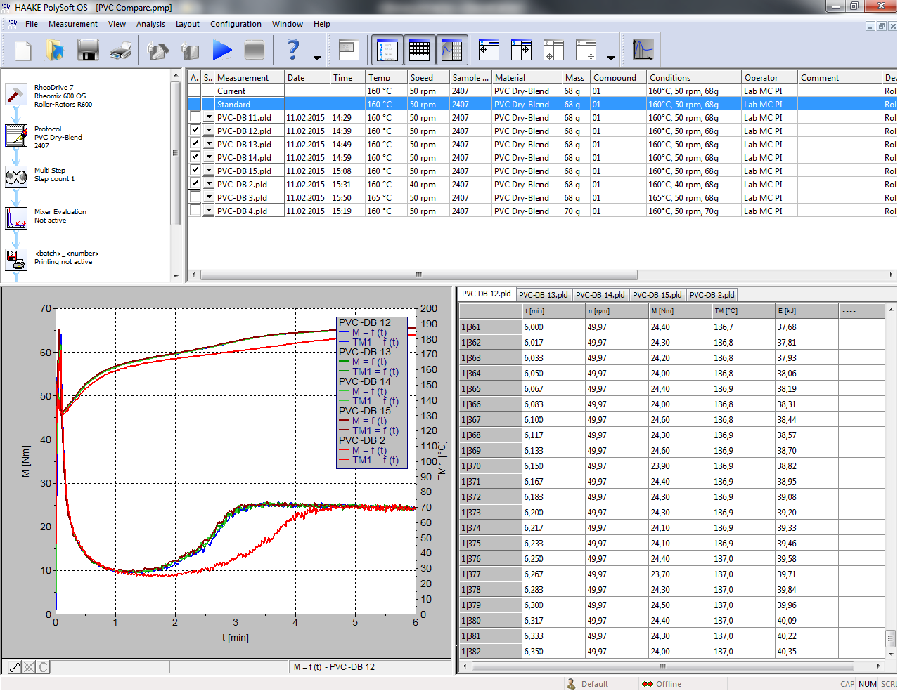
Figure 2. Screen capture - PolySoft OS Mixer Test and Data Evaluation Software. Image Credit: Thermo Fisher Scientific – Materials Characterization
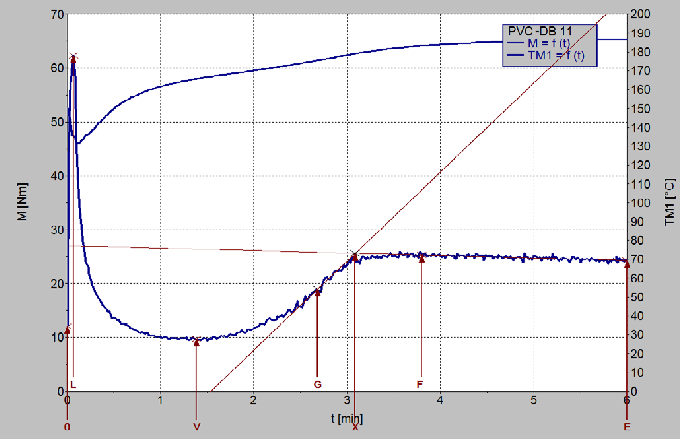
Figure 3. Evaluation of a mixer curve. Image Credit: Thermo Fisher Scientific – Materials Characterization
Figure 3 also shows a straight-line intersection (X) formed by the gradient of the point of inflection (G) and the gradient around the fusion point.
As X is easier to generate than the fusion maximum (F), it is frequently used to compare the fusion behavior of samples. The software creates a measurement report that includes all the results (Figure 4).
Reproducibility of Mixer Tests
Five mixer tests were performed under the same conditions and with the same PVC dry blend to ensure the reproducibility of the results.
Source: Thermo Fisher Scientific – Materials Characterization
| Test conditions |
|
| Mixer temperature |
160 °C |
| Rotor speed |
50 rpm |
| Sample weight |
68 g |
| Test time |
6 minutes |
Figure 5 displays the fusion curves for these five mixer tests on a single graph. The torque curves of these five tests are nearly identical, demonstrating the test method's high repeatability.
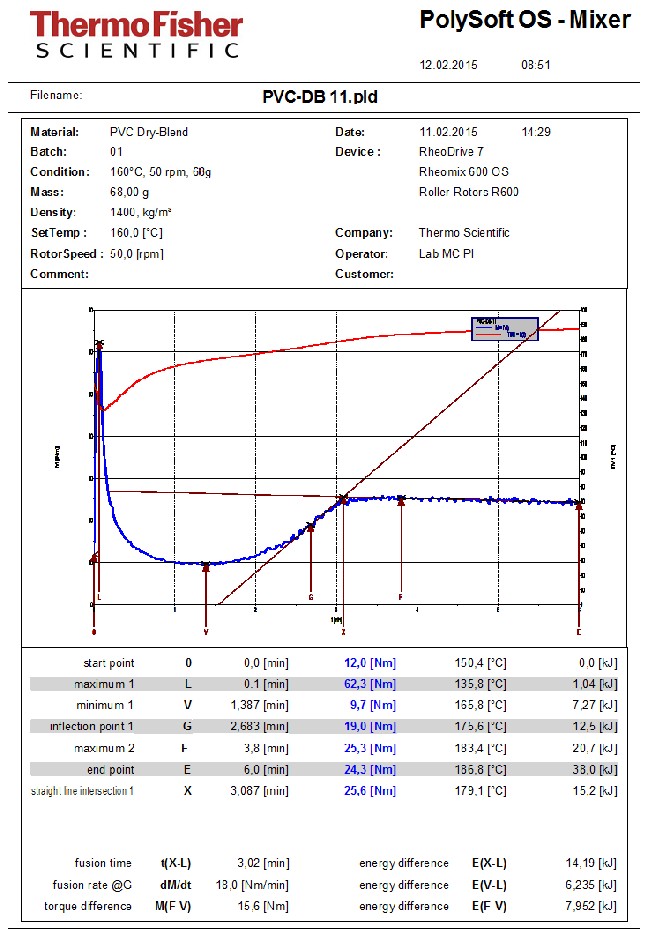
Figure 4. Software report - fusion test of a PVC dry blend. Image Credit: Thermo Fisher Scientific – Materials Characterization
To achieve good repeatability, a user must always operate the mixer in the same manner. Changes in handling or mixing circumstances will immediately affect the test findings.
To demonstrate how slight changes in mixer settings or testing conditions affect measurement findings, the following tests were performed using the same PVC dry blend but with defined modifications in mixing parameters.
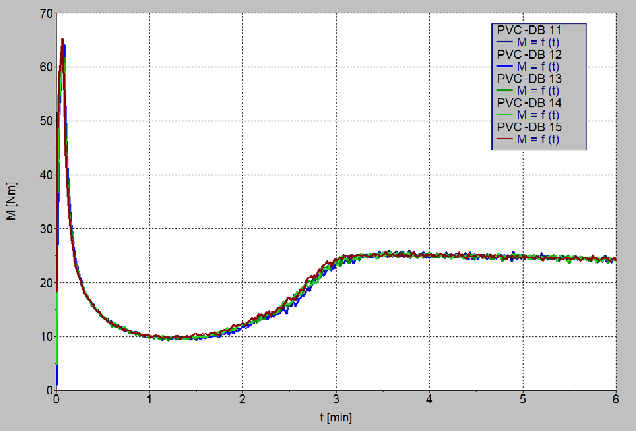
Figure 5. Reproduction of five mixer tests. Image Credit: Thermo Fisher Scientific – Materials Characterization
Influence of the Mixer Speed
Source: Thermo Fisher Scientific – Materials Characterization
| Test conditions |
|
| Mixer temperature |
160 °C |
| Rotor speed |
40 rpm and 50 rpm |
| Sample weight |
68 g |
| Test time |
6 minutes |
Figure 6 shows the effect of mixer speed on measurement findings. The drop in rotor speed causes a substantially longer fusing time. The lower rotor speed introduced less shear energy into the sample.
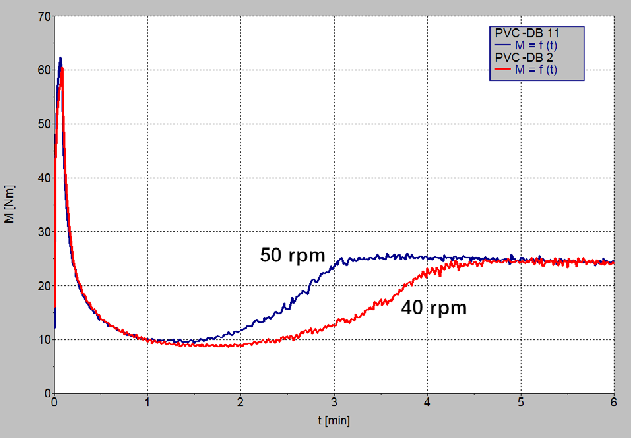
Figure 6. Comparison of different rotor speeds. Image Credit: Thermo Fisher Scientific – Materials Characterization
Influence of the Mixer Load
Source: Thermo Fisher Scientific – Materials Characterization
| Test conditions |
|
| Mixer temperature |
160 °C |
| Rotor speed |
50 rpm |
| Sample weight |
68 g and 70 g |
| Test time |
6 minutes |
The higher sample weight of an additional 2 g of material resulted in a much shorter fusion time (Figure 7). This is because the increased sample volume caused more shearing. It is vital to note that little mistakes made while weighing the sample greatly impact the measurement.
Influence of the Mixer Temperature
Source: Thermo Fisher Scientific – Materials Characterization
| Test conditions |
|
| Mixer temperature |
160 °C and 165 °C |
| Rotor speed |
50 rpm |
| Sample weight |
68 g |
| Test time |
6 minutes |
An increase of only 5 °C resulted in substantially faster sample fusion (Figure 8). For the user, this involves ensuring that the sample is fed at the same temperature. To accomplish this, special attention must be given to maintaining a reproducible cleaning procedure and cleaning time.
Summary
The results demonstrate that testing with the laboratory mixer is reproducible and highly responsive to changes in compound formulations, but also very sensitive to variations in handling and measurement conditions. When handled consistently, the HAAKE PolyLab System, in conjunction with a laboratory mixer, is a dependable tool for characterizing the processing behavior of PVC dry blends.
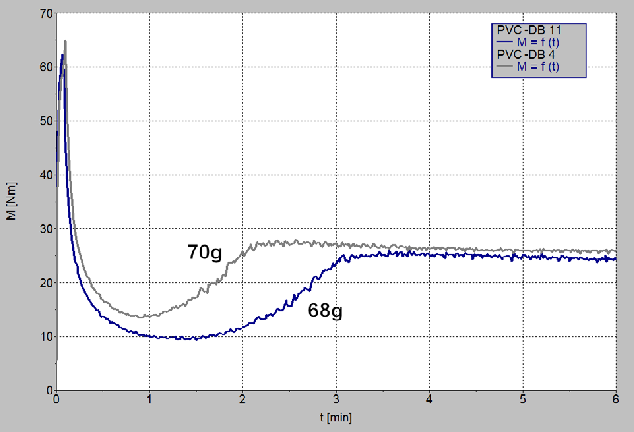
Figure 7. Comparison of different mixer loads. Image Credit: Thermo Fisher Scientific – Materials Characterization
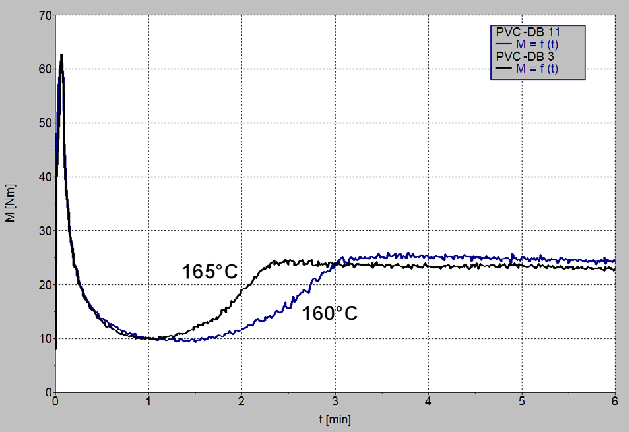
Figure 8. Comparison of different mixer temperatures. Image Credit: Thermo Fisher Scientific – Materials Characterization

This information has been sourced, reviewed and adapted from materials provided by Thermo Fisher Scientific – Materials Characterization.
For more information on this source, please visit Thermo Fisher Scientific – Materials Characterization