Powder injection molding (PIM), which includes metal injection molding (MIM) and ceramic injection molding (CIM), is a cutting-edge manufacturing process for intricate, high-volume precision components.
For example, the automotive industry is currently exploring the use of ceramic turbine blades to withstand engine heat and improve fuel efficiency in vehicles.
CIM feedstocks consist of ceramic powder and a polymeric binder. In addition to the polymeric filler, the final feedstock's flow properties are influenced by its molecular weight and distribution.
To obtain high-precision final products, businesses utilizing PIM must first evaluate the material properties of CIM feedstocks.
Problem Statement
Two different CIM feedstocks were analyzed using a melt flow index (MFI) tester and a mixer sensor. Although this analysis revealed no changes between the two batches, the mechanical properties of the final parts produced from these two feedstocks varied significantly. There were disparities between the two feedstocks.
The purpose of this subsequent test was to distinguish between the two CIM compound samples using a torque rheometer with the necessary hardware and software peripherals. The extruder capillary rheometer tests generate flow curves that can be compared to determine the difference between two samples.
Test Equipment
Thermo Scientific™ HAAKE™ PolyLab™ QC Torque Rheometer System includes:
- HAAKE PolySoft Software with HAAKE Rheomex Single-Screw Extruder 19/25
- Extruder screw with a compression ratio of 2:1
- Rod capillary die with a diameter of d = 1.50 mm and length of l = 30 mm
- HAAKE PolySoft Capillary Rheology Software
- Circulator to cool the feed zone of the extruder
The capillary rheometer is best suited for measuring shear viscosity at process-relevant shear rates. When combined with an extruder sensor and a suitable rheological capillary die, the HAAKE PolyLab QC System can test rheological properties under real-world process settings.
In addition, the HAAKE PolySoft Capillary Rheometry Software facilitates the process by allowing users to pre-define test protocols, conduct measurements automatically, make necessary modifications, and apply regression analysis to model flow channels and molds.
Test Conditions
Source: Thermo Fisher Scientific – Materials Characterization
| test |
test |
| Extruder temperatures |
Feed zone: 20 °C
1st zone: 95 °C
2nd zone: 110 °C
3rd zone: 135 °C |
| Die temperature |
135 °C |
Test Method
To determine the flow behavior of each CIM feedstock, a sample from each batch was plasticized in the extruder. Then, it was transferred to the die and pushed through the capillary. Different shear rates were obtained by adjusting the extruder screw speeds.
The melt pressure in front of the capillary was monitored with a pressure transducer. The attached balance automatically monitored the melt production. After achieving constant pressure and melt throughput numbers, the data was recorded to compute rheological properties.
The software automatically activated the subsequent drive speed that was specified. The observed data were used to calculate shear rate and viscosity, which were then shown on a viscosity curve. The software automatically implemented the appropriate rheological modifications based on Bagley and Weissenberg/Rabinowitsch.
Test Results
The viscosity curve (Graph 1) depicts the viscosity measurements from both batches of CIM feedstock. The graph shows the shear stress (τ) and viscosity (η) above the shear rate (γ).
The binder for the two thermoplastic ceramic feedstocks was a polyolefin, so the curves indicate shear thinning, which is normal for polymers, i.e., a decrease in viscosity as the shear rate increases. Feedstock 2 (CIM2) demonstrated more shear thinning than feedstock 1 (CIM1).
The measured values are equivalent at shear rates < 100 sec-1, but diverge at higher rates. At 1000 sec-1, feedstock 1 has a viscosity 42 % greater higher than feedstock 2.
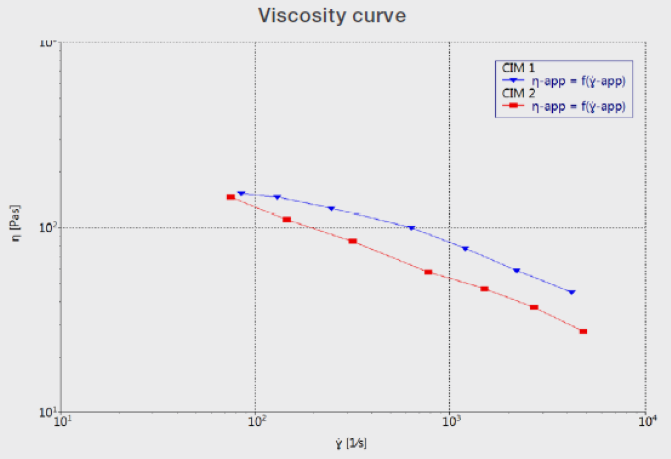
Graph 1. Viscosity curve of two different CIM feedstocks (CIM1 and CIM2). Image Credit: Thermo Fisher Scientific – Materials Characterization
Conclusion
The viscosity readings explain why the two feedstocks could not be distinguished using an MFI tester and a mixer sensor. Shear rates for the testing setup are typically below 100 sec-1, where both feedstocks exhibited similar behavior.
The extruder capillary rheology test allowed for larger shear rates, making it more representative of what happened during the extrusion process or injection molding.
The results demonstrate that feedstock 1 may have issues and not fill the mold, whereas feedstock 2 (because of its low viscosity) may fail to attain the required form stability.
The extruder capillary rheology system provided the necessary data to accurately assess material properties for complicated high-volume precision components.
Summary
The HAAKE PolyLab QC System, equipped with a capillary rheology measuring setup, tested ceramic feedstock flow characteristics quickly and accurately under manufacturing settings. Important material properties that were not obvious with conventional MFI testing could be revealed.
That is, the HAAKE PolyLab QC System may save manufacturing time while ensuring quality by implementing an automated, uniform test regimen. The HAAKE PolySoft Capillary Rheology Software can be configured to perform a test program suitable for various applications.
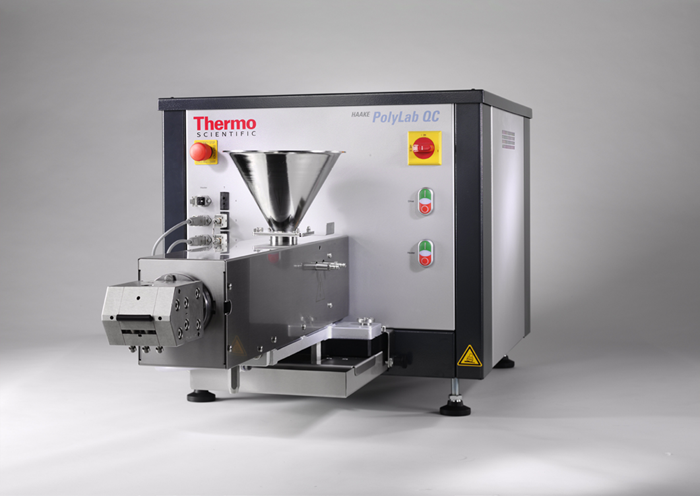
HAAKE PolyLab QC Modular Torque Rheometer. Image Credit: Thermo Fisher Scientific – Materials Characterization

This information has been sourced, reviewed and adapted from materials provided by Thermo Fisher Scientific – Materials Characterization.
For more information on this source, please visit Thermo Fisher Scientific – Materials Characterization