The solid electrolyte interface (SEI) in lithium-ion (Li-ion) batteries is essential for calculating a battery’s capacity and longevity. The SEI works dynamically across multiple charge cycles, and its composition varies over time.
The SEI’s evolving nature, which is especially obvious throughout galvanostatic cycling, greatly impacts the battery’s lifespan and performance.
Much current battery research focuses on assessing the SEI’s molecular structure and chemical composition to create optimized interface designs. Contemporary tools, however, often lack the necessary spatial resolution and sensitivity to assess lithium at interfaces approximately 100 nm thick or under.
The focused ion beam-secondary ion mass spectrometry (FIB-SIMS) approach, alongside the advanced mass analyzer of TOFWERK’s fibTOF detector, addresses this issue.
This article discusses a FIB-SIMS study of SEI composition in a Li-ion battery cell with LiNixMnyCo1-x-yO2 cathodes. It explores transition metal (TM) dissolution from the cathode and its deposition on the anode throughout galvanostatic cycling, alongside the effect of molecular additives on SEI characteristics and TM shuttling.
The TOFWERK fibTOF Detector
Adding a mass analyzer to an FIB-scanning electron microscope enlarges the scope of potential investigations on microscope platforms by facilitating FIB-SIMS. The fibTOF delivers rapid real-time 3D visualization of the spatial distribution of all elements, such as hydrogen and lithium, while the FIB beam mills the sample.3,4
The spatial resolution, which can be better than 50 nm laterally and 10 nm deep, alongside detection limits in the ppm range (such as for B, Li, F), makes the fibTOF an optimal tool for probing the SEI in Li-ion batteries.

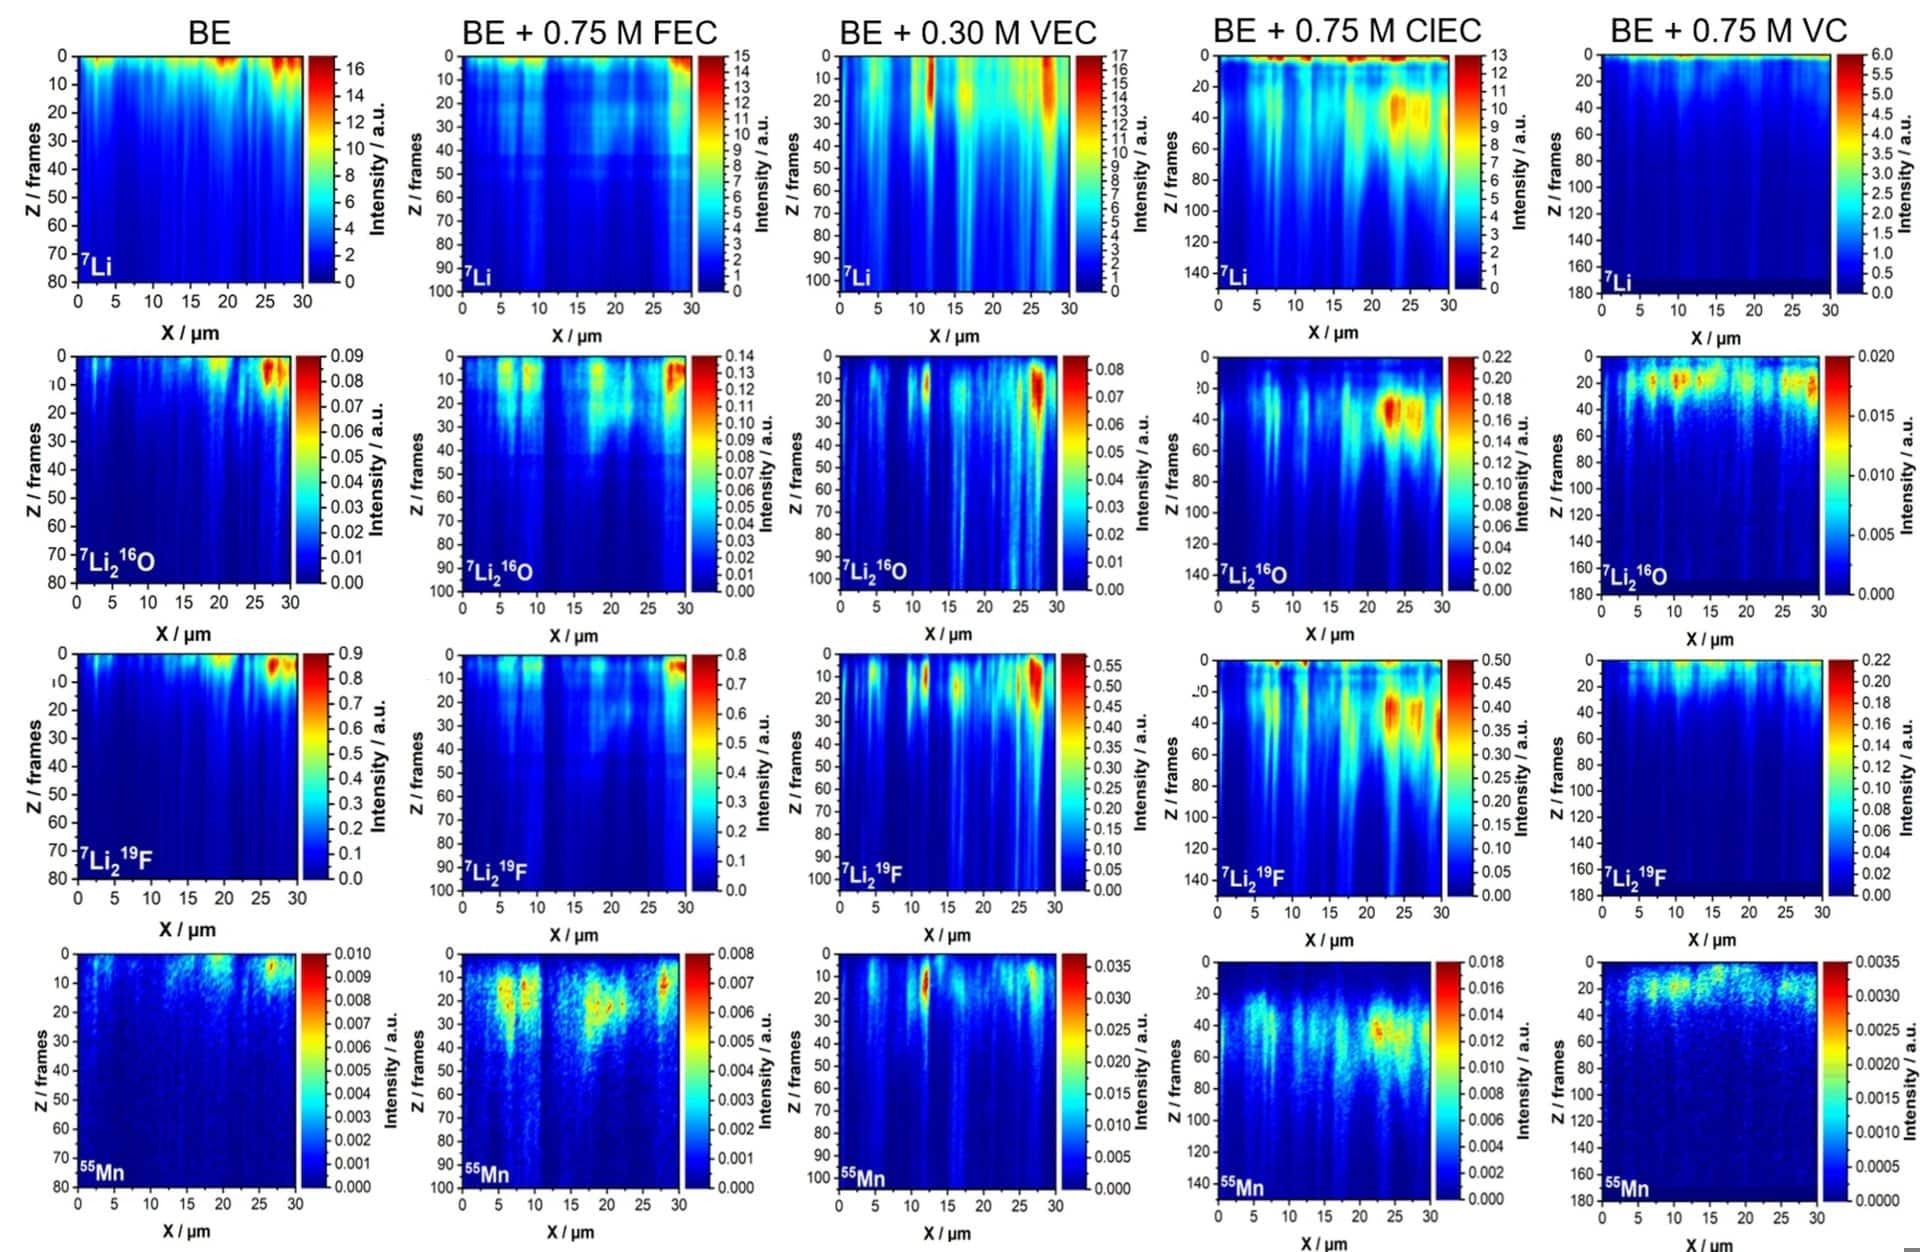
Figure 1. Positive secondary ion elemental maps showing the distributions of the major lithium isotope 7Li+, Li2O+, and Li2F+ molecular ions, and the isotope of manganese 55Mn+ for a lateral projection vs. depth.
The number of frames (Z-axis) is the number of completed raster by the FIB beam, and is directly related to the fluence received and indirectly related to the depth. Projections obtained with the same additive are arranged in columns. BE stands for baseline electrolyte and is the control sample where no additive was applied during cycling 5. Image Credit: TOFWERK
Experimental
This study utilized a gallium FIB with a beam normal to the sample surface. The FIB beam was adjusted to 30 keV and 1 nA, and the field of view was calibrated to 30 µm2.
This study explored six unique graphite anodes LiNi0.6Mn0.2Co0.2O2: one pristine, four cycled to the end of their life (at 50 % state of health), and included vinylene carbonate (VC), fluoroethylene carbonate (FEC), chloroethylene carbonate (ClEC), and vinyl ethylene carbonate (VEC).
SEI Composition
It is possible to choose arbitrary slices averaging and areas of interest from the 3D data set gathered with the fibTOF. The elemental distribution along the SEI, along the FIB beam’s erosion direction (Z), was of special interest. X-Z projections were contrasted, as shown in Figure 1.
These projections were formed by the X values for every probed Y position, lessening the obtainable data from 3D to 2D. The chemical composition distribution of the explored lithium species (Li, LiF, and Li2O) and manganese demonstrates considerable variations along the depth of the electrodes and their corresponding SEIs.
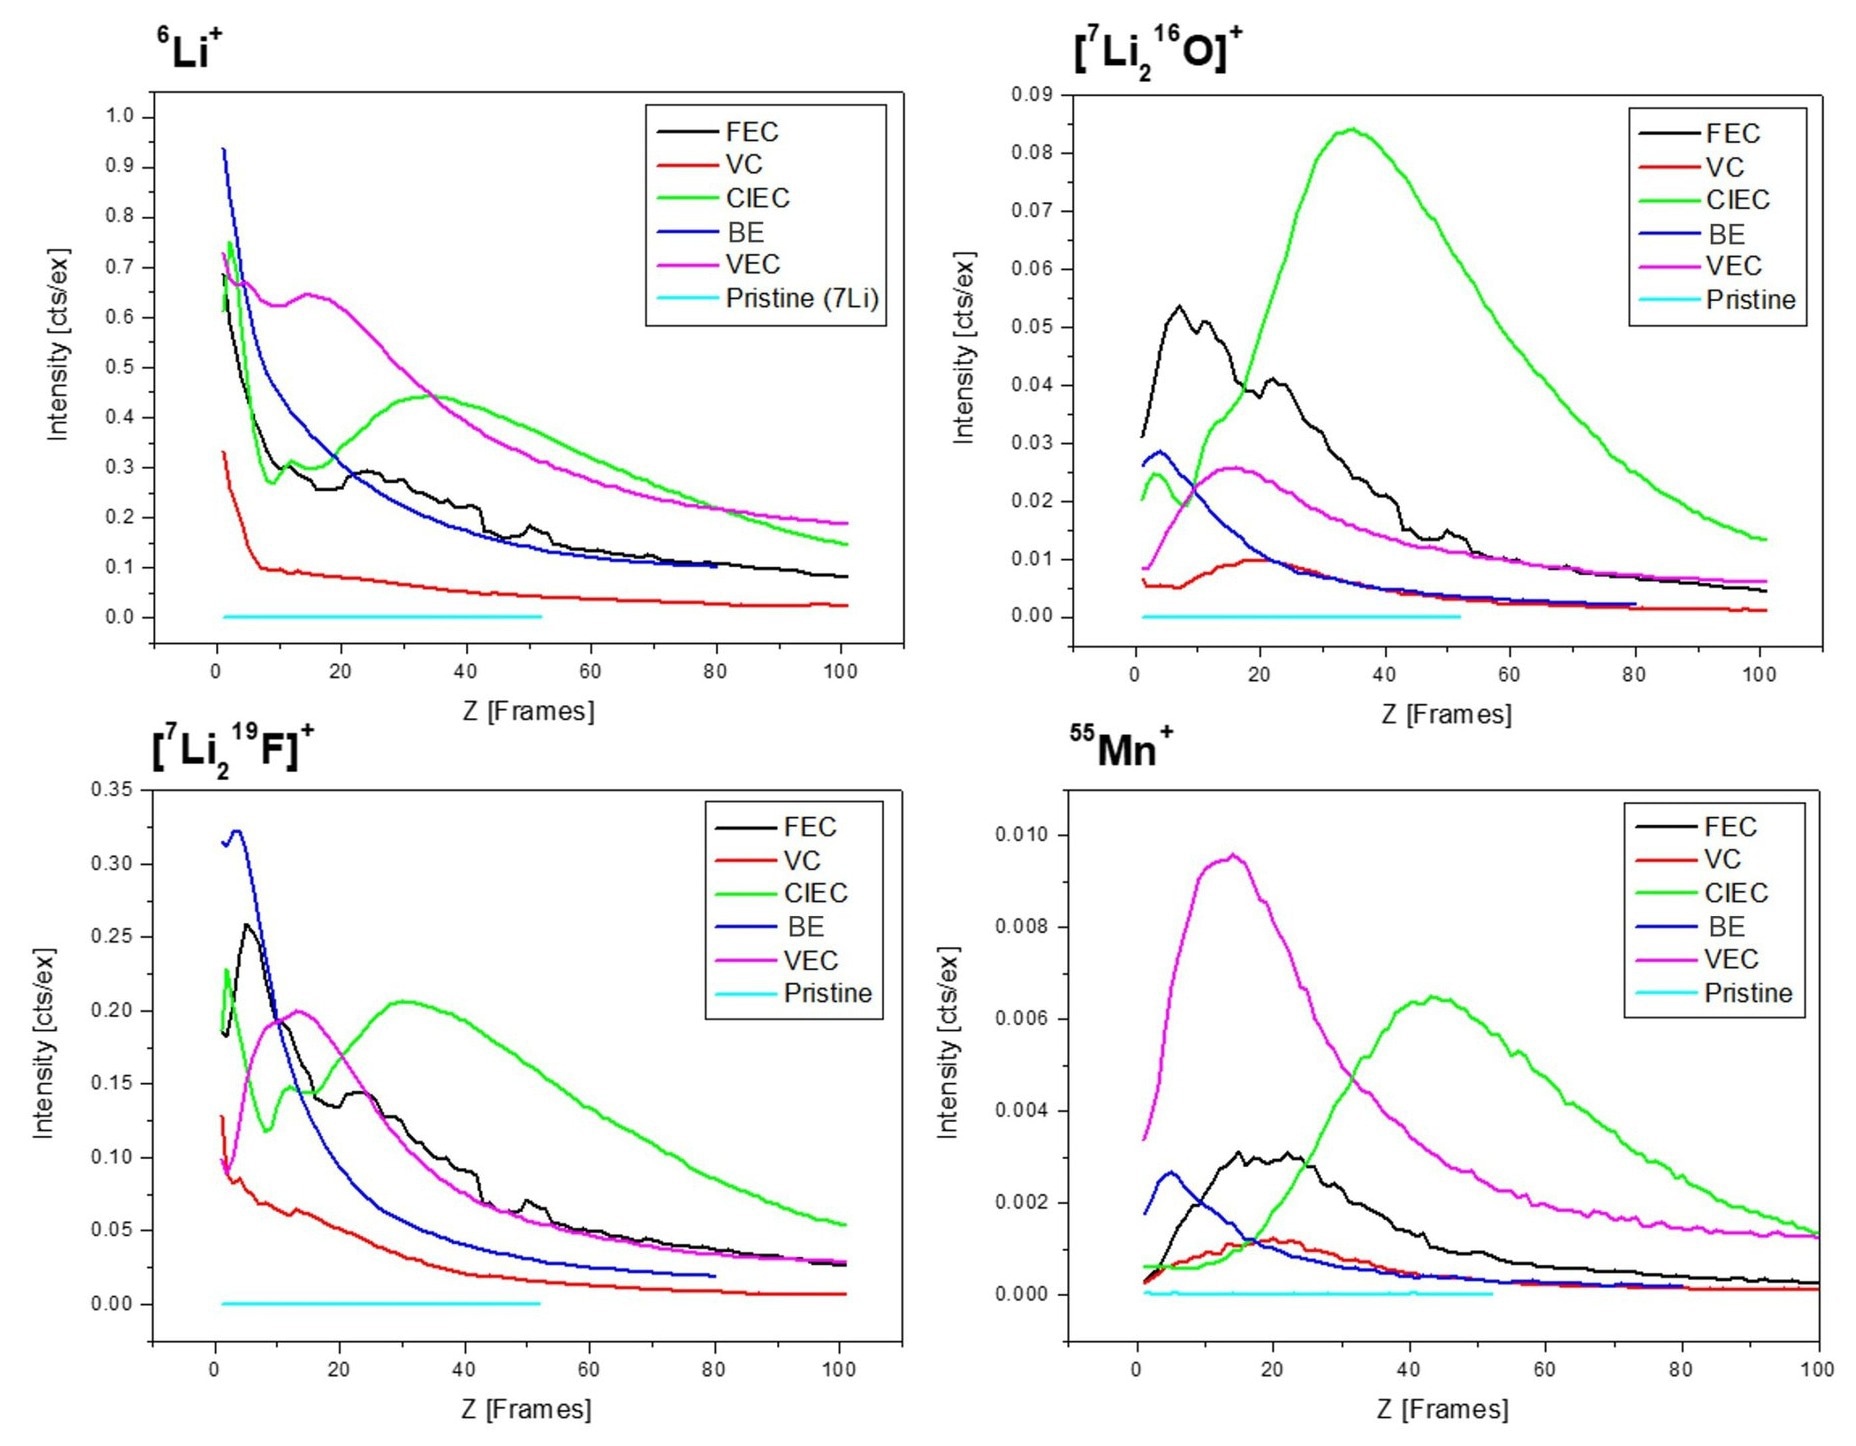
These results became more evident when contrasting them according to depth profile (Figure 2). Depth profiles are gathered by averaging all obtained data points from the same X-Y plane per removed layer (frame), decreasing the data set to 1D.

Figure 2. Depth profiles of several lithium- and manganese-containing secondary ions. The peak position and the extent of the distribution depend upon the additive used.
In addition to the BE control sample, the results for the original sample, the graphite anode that is not cycled (pristine), are plotted, showing the absence of the species under investigation. Image Credit: TOFWERK
Most lithium is located at the topmost layers of the electrodes in the baseline electrolyte (BE) with no additive added sample, and the anodes cycled with added VC or FEC. This suggests effective SEI formation, avoiding additional electrolyte decomposition on the anode.
The anodes cycled with ClEC and VEC contrastingly have a more significant penetration depth of the lithium species, suggesting the formation of an ineffective SEI resulting in continuous electrolyte decomposition and lithium deposition deeper inside the electrode.
A dissimilar trend was noted for the manganese depth profile. Although most manganese is identified in the upper layers for the BE, VC, and VEC samples, manganese is also found in deeper electrode layers for the FEC and ClEC samples.
These results indicate earlier dissolution of the cathode active material for the FEC and ClEC samples, stemming from the formation of hydrofluoric acid and hydrochloric acid, etching transition metal from the cathode active material.6
Conclusion
This article highlights how TOFWERK’s fibTOF can be used for imaging lithium species in the solid electrolyte interface of Li-ion batteries. These light elements are challenging, if not impossible, to capture with similar spatial resolution using other approaches. The research confirmed permanent phase changes and metal dissolution of the cathode.
References and Further Reading
- U. S. Meda et al., Journal of Energy Storage, 47, (2022), p. 103564. https://doi.org/10.1016/j.est.2021.103564
- Y. Chu et al., Electrochemical Energy Reviews, 3, (2020), p. 187. https://doi.org/10.1007/s41918-019-00058-y
- L. Pillatsch et al., Progress in Crystal Growth and Characterization of Materials, 65, (2019), p. 1. https://doi.org/10.1016/J.PCRYSGROW.2018.10.001
- J. A. Whitby et al., Advances in Materials Science and Engineering, (2012), p. 180437. https://doi.org/10.1155/2012/180437
- F. Pfeiffer et al., Advanced Energy Materials, (2024), p. 2402187. https://doi.org/10.1002/aenm.202402187
- J. C. Hestenes et al., ACS Materials Au, 3, (2023), p. 88. https://doi.org/10.1021/acsmaterialsau.2c00060

This information has been sourced, reviewed and adapted from materials provided by TOFWERK.
For more information on this source, please visit TOFWERK.