Vitamin C tablets’ surface roughness is key to defining their surface morphology and, therefore, their delivery rate and interaction time with external stimuli. Surface roughness can be observed via Scanning Electron Microscopy (SEM), and atomic force microscopy (AFM) can be used to quantify it.
Because Vitamin C particles can range in size from several microns to less than hundreds of nanometers, accurately positioning an AFM probe onto specific individual particles can be especially challenging and time-consuming.
These challenges occur for two reasons. Traditional AFM geometry only permits a top-down view of the sample surface when using optical microscopy (OM). This means that it is not easy to observe the AFM tip and direct tip interaction with the sample surface. OM in AFM is also unable to effectively resolve structures below 200 nm, especially versus SEM.
The robust combination of FusionScope’s SEM-enabled Profile View and its shared coordinate mapping allows both of these common challenges to be resolved simultaneously, with no need to alter the sample environment.
This approach minimizes the potential for time-based particle degradation by reducing transfer times and risks of contamination exposure.
Current Challenges
Accurate data on key features is essential when manufacturing Vitamin C and other tablets for health and pharmaceutical-based ingestion. These features include:
- Surface morphology and structure
- Reaction to external stimuli
- Delivery rate
- Levels of contamination
The particles or nanoparticles comprising the tablet must be analyzed using a range of different techniques to better understand these features. Nanoparticle information must also afford manufacturers a clear understanding of the tablet to resolve technical challenges, such as the optimal delivery rate to maximize the particle's impact in supplement and medicinal applications.
This analysis must be performed as efficiently as possible, with minimal resource requirements, maximum throughput, and excellent repeatability.
Current Solutions
Surface roughness is an increasingly significant Vitamin C nanoparticle characteristic due to its impact on surface morphology.
Comprehensive insight into surface morphology allows responses and interactions to external stimuli to be understood with improved clarity, affording manufacturers more precise information on exchange and delivery rates.
Atomic Force Microscopy (AFM) is the best and most popular way to measure this property. While positioning the tip on Vitamin C particles on the µm scale is straightforward, Vitamin C particles are frequently as small as 60 nm. This makes AFM positioning especially challenging using the conventional optical microscopy found on the majority of AFMs.
It is also important to note that, because the surface of Vitamin C tablets on the nanometer scale and micrometer scales are very rough, this poses further challenges to accurate AFM positioning using conventional approaches. There is also an added risk of tip contamination, as well as this being out of position.
Researchers in academia and industry employ various techniques to acquire this nanoparticle-based information. These include:
- X-ray Diffraction (XRD) for crystallinity information
- Energy Dispersive X-ray Spectroscopy (EDS) for direct chemical information
- Transmission Electron Microscopy (TEM) for porosity information
Scanning Electron Microscopy (SEM) is routinely used to acquire Vitamin C particles’ morphology and size-based information.
SEM can also be used to monitor a particle’s morphological changes upon exposure to external stimuli, for example, where Vitamin C is encapsulated by TPP-chitosan microspheres or hydroxiapetite-based Vitamin C for treating bone infections.
Information on surface structures can be acquired via observation, while size can be measured by extrapolating these images.
The FusionScope® Approach
The example presented here features a comprehensive investigation into Vitamin C particles using the FusionScope correlative analysis platform.
The powerful FusionScope instrument offers high-resolution imaging and precise measurements at the nanoscale by seamlessly combining SEM, AFM, and EDS in a single platform and a single user interface.
The robust combination of SEM imaging, AFM topography measurements, and force-distance curve analysis allows users to extract individual particle morphologies, potential contaminations on particle surfaces, and particle surface roughness.
Enhanced analytical methodologies in particle research and analysis are made possible by the FusionScope’s capacity to identify specific individual particles with the SEM, precisely guide the cantilever tip to the point of interest, and then observe the AFM measurements using the instrument’s SEM-enabled Profile View.
Workflow

Figure 1. Workflow to obtain correlative AFM-SEM data on Vitamin C particles using the FusionScope. (a) Identifying target Vitamin C particle. (b) Profile View of cantilever tip positioned on particle. (c) High-resolution AFM image of particle topography. (d) Correlated AFM/SEM image of particle. Image Credit: Quantum Design, Inc.
In the study shown, it was possible to easily identify and locate the targeted Vitamin C particle using the SEM (Figure 1a). It is important to note that charging typically plays a major role in the SEM imaging of organic particles, and this can hinder the instrument’s capacity for accurate measurements.
A beam acceleration voltage of 3.5 kV was employed while working in Profile View to address this challenge. This involved leveraging an 80° tilt of the sample and AFM in respect to the SEM. Using this approach, it was possible to curb the charging phenomenon effectively.
FusionScope users can also benefit from the instrument’s unified coordinate system of AFM and SEM, which enables precise automated AFM tip navigation to the desired particle. Profile View provides a direct line of sight to the cantilever tip region, allowing users to ensure accurate tip positioning at the desired particle location (Figure 1b).
Then, high-resolution AFM measurements in amplitude modulation (AM) mode (Figure 1c) can be performed, with the SEM affording users real-time visualization of cantilever tip movement.
Using the FusionScope software, it is possible to directly correlate both SEM and AFM data, making direct data analysis straightforward (Figure 1d).
Analyzing a Variety of Vitamin C Particles

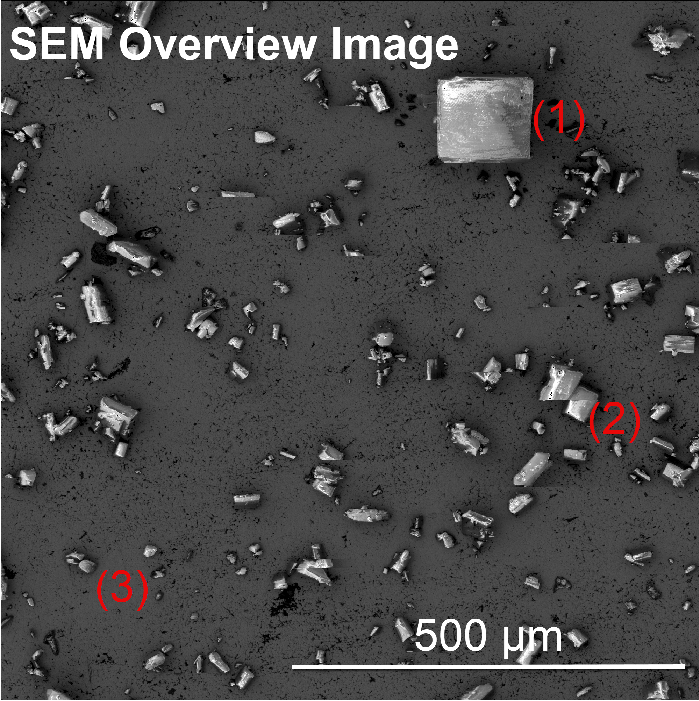
Figure 2. SEM overview image of different Vitamin C particles. Large (1), medium (2), and small (3) particles can be identified. Image Credit: Quantum Design, Inc.
Figure 2 features an SEM overview image, highlighting various particles with diverse sizes. The range of particle sizes present is extensive, from relatively large particles with diameters > 100 µm (1), to medium-sized particles with diameters > 10 µm (2), and down to a large number of diminutive particles (3).
This study focused on analyzing three particles exhibiting different shapes and/or sizes, assessing their surface roughness to comprehensively characterize these distinct particles.
Figure 3 features the SEM top view of the three individual particles under investigation. The different sizes and structures of the particles can be easily observed in this instance.

Figure 3. SEM Top View of three different individual Vitamin C particles. Image Credit: Quantum Design, Inc.
Roughness Measurement Using the FusionScope
Seamless navigation of the AFM tip toward each particle is facilitated by FusionScope’s unified coordinate system for both SEM and AFM (Figure 4). The near-orthogonal perspective of the tip and sample further facilitates precise positioning. This is especially advantageous when approaching small or rough structures, such as those exhibited by Particle 3.

Figure 4. SEM Profile View of the cantilever approaching three different particles. Image Credit: Quantum Design, inc.
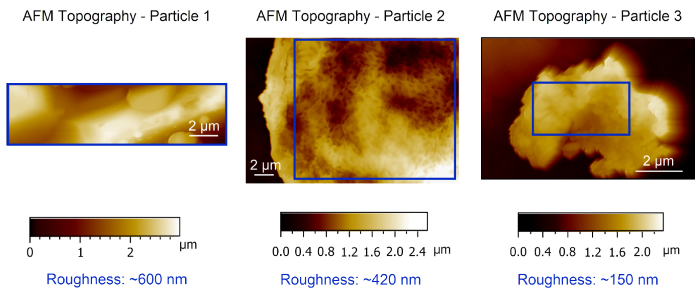
Once the tip has been positioned, high-resolution AFM measurements in AM mode can be performed on all three particles (Figure 5). Particle 2 features an internal structure not visible in Particles 1 and 3, a feature already suggested in the SEM top view images (Figure 3).
Acquired AFM data reveals a sample roughness of 600 nm for Particle 1, 420 nm for Particle 2, and 150 nm for Particle 3.
The results shown here demonstrate the FusionScope’s capacity to rapidly and easily analyze the surface topography and roughness of individual Vitamin C particles, independent of their surface morphology or size.

Figure 5. AFM Topography data recorded in AM mode on each individual particle are shown. The blue rectangle indicates the area in which the roughness measurement was carried out. Particle roughness varies from ~600 nm (Particle 1), to ~420 nm (Particle 2), and ~150 nm (Particle 3). Image Credit: Quantum Design, Inc.
Using Phase Imaging and Force-Distance Curves to Investigate Possible Contamination
The accurate identification of specific contaminations represents a common challenge in particle preparation. FusionScope offers a robust solution to identify and analyze potential particle surface contamination by combining phase imaging and force-distance curves for individual particles.
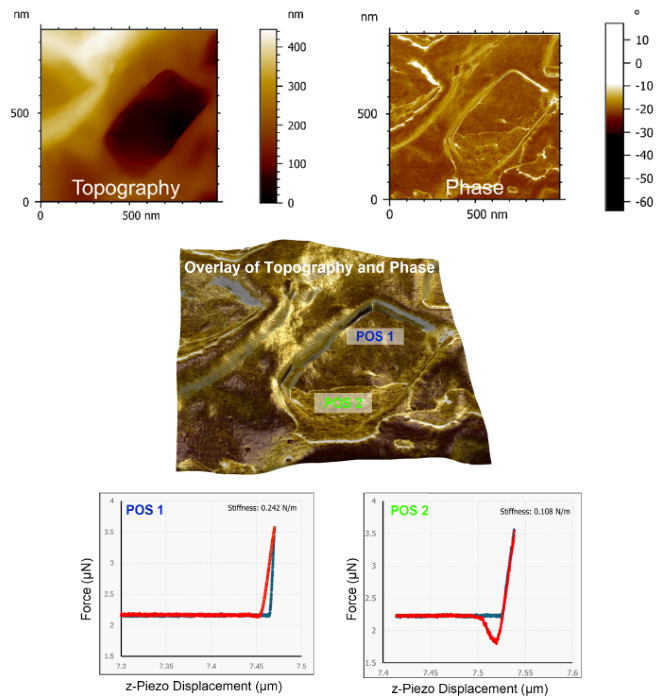
In the example presented here, acquiring high-resolution AFM measurements of Particle 2 reveals a distinctive cave-like structure within its topography (Figure 6, top left).
However, a phase contrast is evident within the crater, indicating the presence of a different surface material and signaling potential contamination (Figure 6, top right). This potential contamination becomes clearer in the overlayed image of AFM topography and phase (Figure 6, middle).
The use of force-distance curves on the two different areas inside the crater structure reveals that the potentially uncontaminated part of the particle (Figure 6, bottom left, Position 1) exhibits a greater degree of hardness versus the contaminated part (Figure 6, bottom right, Position 2). Position 2 also shows stronger adhesion compared to Position 1.
The presence of these two characteristics in the force-distance curves confirms that Particle 2 comprises different materials.

Figure 6. (Top) High-resolution AFM topography and phase image of Particle 2 indicates a possible contamination. (Middle) Overlay of AFM topography and phase image revealing the two different materials in the crater structure. (Bottom) Force-Distance Curves at Position 1 and Position 2 indicating different hardness and adhesion. Image Credit: Quantum Design, Inc.
Preventing Misinterpretation of Force-Distance Curves
Several major challenges may be encountered when interpreting force-distance curves to gain insight into a sample’s mechanical properties.
This is especially true for small, non-flat structures like fibers, particles, or nanowires, where the cantilever moving or damaging samples while obtaining force-distance data can be risky.
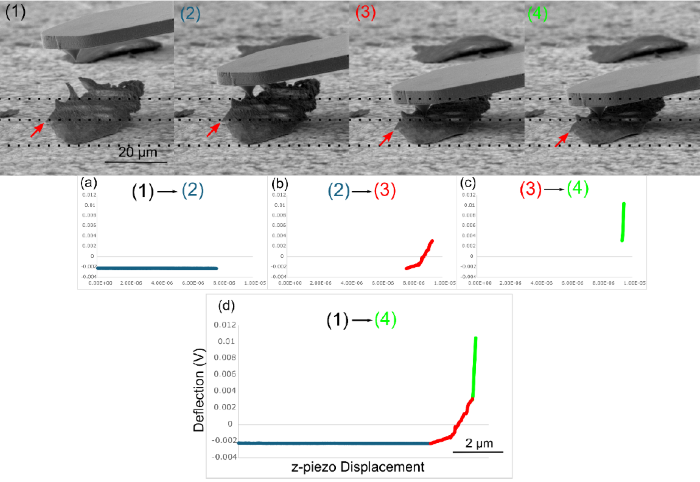
Observing the cantilever's movement during the force-distance curve is important to identify potential artifacts like the one illustrated in Figure 7. The entire force-distance curve is observed in Profile View using the SEM.
As the cantilever approaches the sample surface, (1) it comes into contact with the sample (2). The cantilever pushes the particle onto the surface (3) before mechanically probing the particle (4).
This phenomenon results in the cantilever bending, as evidenced by the red curve (Figure 7b). This distortion could lead to misinterpretation of the slope, inadvertently recording this as a genuine mechanical property of the sample.
FusionScope removes the risk of these misleading results by combining force-distance measurements with SEM Profile View, enabling the comprehensive analysis of small objects’ mechanical properties.

Figure 7. SEM images 1 - 4 show the position of the cantilever during the acquisition of a force-distance curve. To illustrate the movement of the particle during the force-distance curve, horizontal dashed lines were added to the SEM images. The force-distance curve was divided into three sections (a-c). The force-distance curve (shown in (a)) in the range between images 1 and 2 shows constant deflection of the cantilever during the initial approach to the particle surface. The range between 2 and 3, on the other hand, shows an increase in the deflection (b). This deflection is because the cantilever pushes the particle downward onto the surface and does not exhibit any real mechanical data. The green curve in (c) shows the sequence of the force-distance curve between the SEM images 3 and 4. A very steep increase can be noticed since the particle is now completely pushed onto the sample surface. The complete force-distance curve is shown in figure (d). Image Credit: Quantum Design, Inc.
Summary
The study presented here shows the potential of the FusionScope instrument in reducing transfer time between different measurement systems. This is made possible by performing all measurements within a single sample chamber and user interface.
Different measurement modes are combined into a single system, making it simpler to use and learn, and lowering the amount of expertise required in each technique. Using the FusionScope’s intuitive interface, a single user can rapidly learn to use all relevant techniques on one platform.
Acquiring data via AFM is now straightforward, as users can observe the cantilever tip approaching the sample surface. This minimizes measurement setup time, reduces contamination risks, and lowers the chance of tip damage and its related inspection time.
Measurements can be performed correlatively using a joint coordinate system, allowing users to directly acquire like-for-like data independent of time, at any angle of interest, and at very localized scales.
The FusionScope system is easy to maintain and features excellent service and support.
FusionScope® Application Note: Correlative AFM SEM of Vitamin C Particles
FusionScope® Application Note: Correlative AFM SEM of Vitamin C Particles. Video Credit: Quantum Design, Inc.
Acknowledgments
Produced from materials originally authored by Quantum Design.

This information has been sourced, reviewed and adapted from materials provided by Quantum Design.
For more information on this source, please visit Quantum Design.