The technique in this article explores applied radio frequency fields B1 expressed and employed as nutation frequencies for nucleus i,ƒ(1,i)=1/2π |1/2 γi Br,i|, vital constraints in solid-state nuclear magnetic resonance (NMR) studies as decoupling fields or spinlock fields in cross-polarization (CP).
The term nutation frequency pertains to ω1,i=|1/2γi Brf,i|, with ƒ1,i=1/2π ω1,i. These rf-fields ƒ1 are frequently associated with the mechanical sample rotation frequency around the magic angle ƒMAS.
An AU-program within the parameter set reads the magic angle spinning (MAS) frequency automatically and records the ƒMAS value to the parameter cnst31. The parameter cnst31 is traditionally employed as the MAS frequency in pulse programs. It allows any study to be performed under numerous MAS spinning conditions under a straightforward standard operating procedure (SOP).
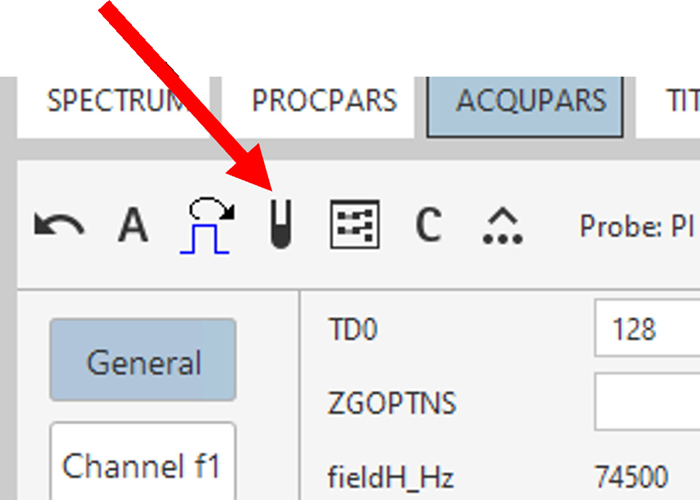
The SOP includes loading the sample, spinning it up to the required MAS rate, loading the parameter set in TopSpin, and inspecting the PROSOL parameters. PROSOL parameters are read into the parameter set by employing the solvent button illustrated in Figure 1 or by entering “getprosol” into the command line.

Figure 1. The solvent button in TopSpin can be used to read PROSOL parameters into the parameter set. Image Credit: Bruker BioSpin Group
The study can begin with the command xaua, inputted into the command line of TopSpin, after adjusting and coordinating the NMR probe to the appointed rf-frequencies. The command xaua performs an au-program as part of the acquisition parameter set.
The AU-program scans the programmed MAS frequency from the MAS controller and inputs its value into cnst31=ƒMAS=MASR. The parameter MASR is generally only employed when the MASRSET is administered.
The parameter MASR within the acquisition status parameter set reports the MAS frequency employed when the study was performed. The status parameter can be found utilizing the letter “s” before inputting the parameter name into the command line, e.g. 1s MASR or s MASR.
Automated testing can be executed in IconNMR, Bruker’s computerization program that loads studies. IconNMR performs all required steps, sample loading (if a sample changer is offered), tuning and matching, loading the proper shim file, and setting the required MAS frequency when utilizing a CPMAS iProbe.
Other CPMAS probes demand manual tuning and matching after sample loading before initiating the study in IconNMR.
TopSpin Implementation
The pulse programs with the viewpoints detailed in the article by C. Johann et al.1 were initially applied in TopSpin 4.4. These pulse programs utilize the nutation frequency/B1 field and facilitate correction terms in frequency units of Hz for rf-power/rf-field correction of the different pulse sequence components in a study.
A well-setup spectrometer does not necessitate these correction terms but can be used at the spectroscopist’s discretion.
The studies consider that MAS defines many foundations of solid-state NMR experiments, such as the rf-amplitude of the spinlock pulse for the zero quantum CP matching condition.
The Hartmann Hahn matching condition2 under MAS for nuclei i and s under MAS relies on the MAS frequency1,2,3 ƒ1,i - ƒ1,s = nƒMAS.
Simply put, the s-nucleus is any X-nucleus from 31P to lower frequency nuclei but the i-nucleus is predominantly 1H and sometimes 19F. The nucleus i is usually the nucleus from which the magnetization is transferred, while the nucleus s receives the magnetization in a CP study (Figure 2).
The pulse program fills the specified maximum spin nutation frequency f1,s=1/2π |1/2 γs Brf,s |, for the low gamma i-nucleus and evaluates from ƒMAS with n=1 the rf-power needed for ƒ1,i=nƒMAS+ƒ1,s.
![CPMAS experiment with nucleus i being the 1H channel, typically and s any lower gamma nucleus. The contact pulse with the ramped amplitude is generally on the high gamma nucleus but can be used on the low gamma nucleus as well. Often, tangential amplitude modulated pulses are employed promising better magnetization yield [3, 4]](https://www.azom.com/images/Article_Images/ImageForArticle_24160_17341767309246864.png)
Figure 2. CPMAS experiment with nucleus i being the 1H channel, typically and s any lower gamma nucleus. The contact pulse with the ramped amplitude is generally on the high gamma nucleus but can be used on the low gamma nucleus as well. Often, tangential amplitude modulated pulses are employed promising better magnetization yield 3, 4. Image Credit: Bruker BioSpin Group
A 10 kHz reference field in the PROSOL table is used to determine and adjust the accurate rf-power.1 The rf-fields for the spinlock pulse of the i-nucleus are derived from the PROSOL table, which includes probe specifications and should be configured during installation by a Bruker engineer or an NMR manager.
By default, the CP pulse for the X-nucleus is a constant amplitude rf-pulse. For 1H, the default is a tangentially modified pulse shape5 with an rf-field exceeding the X-nucleus B1-field by fMAS.1,5
The maximum rf-fields for the s-spins, the highest decoupling field for the i-spin channel, and the reference rf-fields and rf-power values for both nuclei are retrieved from the PROSOL table via the relations file, determining the connection between PROSOL table entries and the study constraints demanded by the pulse program.
This setup enables automation by using an experiment parameter set that includes the relevant pulse program. Table 1 lists current parameter sets for the s-nuclei 31P, 13C, 29Si, 15N, 209Pb, 79Br and 27Al. Additional experiments can be provided upon request by Bruker’s solid-state applications team.
Table 1. Solid-state NMR Experiments which make use of the method described in this application note. The extension *.dp stands for direct polarization while *.cp stands for cross polarization experiment. Source: Bruker BioSpin Group
| Name |
Pulse Program |
Comment |
| 1HDPMAS |
onepulse |
Direct Polarization experiment also called Bloch-decay. |
| 1HSATRECT1 |
satrect1 |
Proton Detected T1-relaxation experiment using saturation recovery. |
1HSATRECT1_
echo |
satrect1_
echo.dp |
Proton Detected T1-relaxation experiment using saturation recovery with Hahn-echo detection. Requires 8 scans. |
| 1HHOMCOR |
hH_HOMCOR.dp |
Experiments for 1H CS referencing and scaling factor correction in FSLG HETCOR experiments. |
| 1HT1rho2D |
hXT1rho.dp |
1H DP T1rho-experiment. The parameter cnst14 is the 1H spinlock field in Hz. |
| 13CCPMAS |
hX.cp |
Basic 13C CPMAS experiment. |
13CCPMAS_
LPDEC |
hX.cp |
13C CPMAS experiment with low-rf-field decoupling and extended acquisition time beyond 50 ms. The low power decoupling is by default 1/4 of MAS frequency. Standard parameter set for adamantane shimming and referencing experiments. |
| 13CCPNQS |
hXnqs.cp |
13C editing experiment for full suppression of non-quaternary carbons (also called dipolar dephasing, vary d20 and adjust the echo delay if necessary. |
| 13CCPPI |
hXcppi.cp |
13C multiplicity editing experiment. Vary p16 for optimal CH2-negative intensity, CH groups. Optional: set p15 38 us and p16 to 45 us permits detecting CH2-only spectra. |
| 13CCPTOSS |
hXtoss.cp |
13C Total Sideband suppression for slower MAS rates. Make sure delays stay positive through adjustment of MASR or p2 do not collide, otherwise spin slower or increase rf-power for a shorter p2. |
| 13CCPTOSSNQS |
hXtoss_
nqs.cp |
13C experiment with dipolar dephasing and TOSS. Optimal dephasing time removes CH and CH2 resonances. |
| 13CDPMAS |
hX.dp |
13C direct polarization experiment with 1H decoupling. |
13CDPMAS_
LPDEC |
hX.dp |
13C direct polarization experiment with 1H low power decoupling at 1/4 of the MAS frequency and with longer acquisition time.
|
| 13CHETCOR2D |
hXHETCOR.cp |
13C-1H correlation experiment using FSLG homonuclear decoupling. The sampling rate in t1 is determined by the parameter L3. |
| 13CT12D |
hXT12D.cp |
13C CP based T1-experiment using the Denis Torchia trick leading to, M∞=0, which permits faster experimentation and easier fitting the relaxation to an exponential decay. |
| 15NCPMAS |
hX.cp |
15N CPMAS experiment with 1H high power decoupling. |
| 15NDPMAS |
hX.dp |
15N DPMAS experiment with 1H high power decoupling. |
| 27AlDPMAS |
hX.dp |
27Al DPMAS experiment. |
| 29SiCPMAS |
hX.cp |
29Si CPMAS experiment with 1H high power decoupling. |
| 29SiDPMAS |
hX.dp |
29Si DPMAS experiment with 1H high power decoupling. |
| 31PCPMAS |
hX.cp |
31P CPMAS experiment with 1H high power decoupling. |
| 31PDPMAS |
hX.dp |
31P DPMAS experiment with 1H high power decoupling. |
| 31PSATRECT1 |
satrect1 |
31P DPMAS T1-saturation recovery experiment with 1H high power decoupling. |
| 207Pb |
onepulse |
207Pb DPMAS experiment. |
| 19FDPMAS |
hX.dp |
19F DPMAS experiment. |
19FSATRECT1_
echo |
satrect1_
echo.dp |
19F DPMAS T1-saturation recovery experiment. |
Practical Examples
Figures 3 and 4 illustrate results from experiment runs. The only necessary optimization is adjusting the recycle delay D1 by determining the 1H T1-relaxation employing 1HSATRECT1 or SATRECT1_echo.
SATRECT1_echo utilizes a Hahn-echo for 1H detection, which can lower a probe's 1H background. The first method is quicker, requiring only one scan, while the second takes eight scans.
The recycle delay D1 is calculated by multiplying T1 with a factor k, D1=kT1,k≥1.4. The factor varies according to study type.
![13C CPMAS project on tyrosine with an automation run at 7 kHz MAS using IconNMR. CPMAS is shown in blue, CPPI multiplicity editing [2] in red, CPTOSS in green and TOSS NQS in purple](https://www.azom.com/images/Article_Images/ImageForArticle_24160_17341767384613681.png)
Figure 3. 13C CPMAS project on tyrosine with an automation run at 7 kHz MAS using IconNMR. CPMAS is shown in blue, CPPI multiplicity editing 2 in red, CPTOSS in green and TOSS NQS in purple. Image Credit: Bruker BioSpin Group
![13C HETCOR experiment on fMLF tripeptide run in full automation. [5]](https://www.azom.com/images/Article_Images/ImageForArticle_24160_17341767474454862.png)
Figure 4. 13C HETCOR experiment on fMLF tripeptide run in full automation. 5 Image Credit: Bruker BioSpin Group
Solid-State NMR Experiments with IconNMR
These experiments can be performed with or without a sample changer in IconNMR. The IconNMR setting is simple and enables data acquisition for single or multiple samples.6
After completing the 1H T1 experiment, the experiments can be queued in IconNMR, setting D1 correctly and selecting the required MAS rate, which could differ for the various experiments.
IconNMR will vary the MAS rate as requested and run the queued experiments sequentially. The spectra in Figures 3 and 4 were acquired utilizing IconNMR.
References
- Hartmann, S.R. and Hahn, E.L. (1962). Nuclear Double Resonance in the Rotating Frame. Physical Review, 128(5), pp.2042–2053. https://doi.org/10.1103/physrev.128.2042.
- Hediger, S., Meier, B.H. and Ernst, R.R. (2000). Adiabatic passage Hartmann-Hahn cross polarization in NMR under magic angle sample spinning. Chemical Physics Letters, [online] 240(5-6), pp.449–456. https://doi.org/10.1016/0009-2614(95)00505-X.
- Johann, C. et al. (2023). Automation in solid state NMR, Journal of Magnetic Resonance, 355, p. 107554. https://doi.org/10.1016/j.jmr.2023.107554.
- Meier, B.H., (1992). Polarization transfer experiments in solid-state NMR. Chemical Physics Letters, 188, pp.201–207. https://doi.org/10.1016/0009-2614(92)90009-c

This information has been sourced, reviewed and adapted from materials provided by Bruker BioSpin Group.
For more information on this source, please visit Bruker BioSpin Group.