Infrared hyperspectral imaging enables detection, identification, quantification and visualization of gases in the atmosphere from long distances. The technique enables an assessment of the position, the dimensions and the dispersion of gas clouds.
Imaging Fourier Transform Spectrometer
The hyperspectral imager is based on the combination of a Michelson interferometer and a focal plane array detector (Fig. 1). A spectrum is determined for each pixel of the array. The spectrum comprises the infrared signature of the scene that can be used to analyze gases, liquids, and solids.
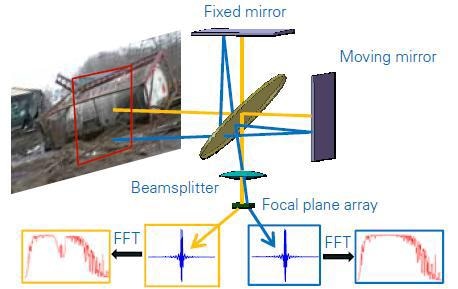
Figure 1. Principle of an imaging Fourier transform spectrometer.
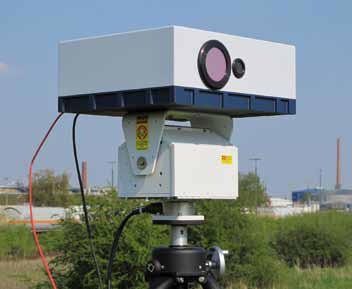
Figure 2. HI 90.
Interferometer
The plane mirror interferometer consists of an active mirror alignment mechanism. The maximum spectral resolution of the interferometer is 0.7 cm-1. The plane mirror interferometer with active alignment has a high efficiency and thus the hyperspectral image cubes result in high-quality spectra and low noise, yielding superior performances than conventional systems based on interferometers employing cube-corner mirrors.
Specifications
| Spectral range |
870 - 1440 cm-1 (other ranges optional) |
| Focal plane array |
MCT, 256x256 pixels |
| Field of view (per pixel) |
0.69 mrad |
| Interferometer |
Plane mirror, active alignment |
| Maximum spectral resolution |
0.7 cm-1 |
| Spectral resolution for gas detection |
4 cm-1 |
| Radiometric calibration |
Automatic, internal calibration system |
| NEΔT per pixel |
180 mK (Δσ = 5 cm-1, typical, single scan) |
| Dimension (ca.) |
550x455x210 mm3 |
| Mass (ca.) |
33 kg |
Measurements
The brightness temperature spectrum of each pixel is studied for the target compounds present in the spectral library of the system.
Examples of Measurement Results
Figure 4 shows the results of a typical measurement and some example of the real-time display. Hyperspectral systems permit the use of both the spectral and the spatial information.
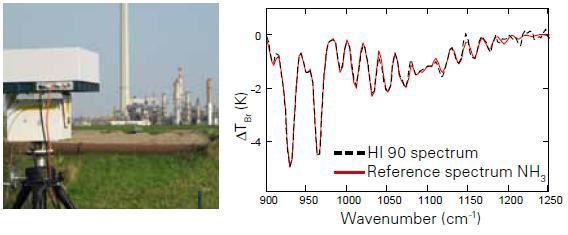
Figure 3. Industrial application, example of a measured spectrum (single scan, single pixel) and a reference spectrum calculated using data of the HITRAN data base.
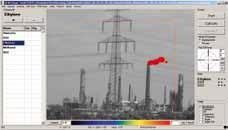
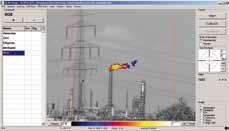
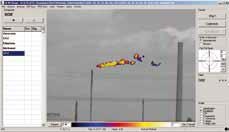
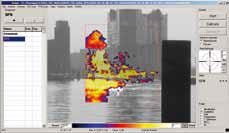
Figure 4. Examples of the real-time display.

This information has been sourced, reviewed and adapted from materials provided by Bruker Optics.
For more information on this source, please visit Bruker Optics.