IPS offers a complete range of programmable Raman probes with the following features:
- Common design for single or dual-wavelength probes
- Optical design for high throughput and efficient Raman gathering
- Various single-wavelength designs (405, 532, 638, 785, 808, 830, and 1064 nm) for analyzing the fingerprint (0-2000 cm-1) Raman band
- Multiple dual-wavelength designs (680/785, 735/830, 860/1064 nm) for analyzing fingerprint (0-2000 cm-1) and stretch (2000-4000 cm-1) Raman bands. Dual wavelength excitation sources can extend the scattered Raman wavenumber range to encompass the fingerprint (0-2000 cm-1) and stretch regions (2000-4000 cm-1) with a single spectrometer.
- Included Teflon standard in shutter for reference measurements
- Configurable working distance (1.6-20 mm)
- Configurable excitation spot size
- Configurable excitation optics optimize NA (0.18-0.55) for various excitation fibers
- Collection optics can be configured to optimize NA (0.18-0.55) for various f# spectrometers.
- Removable collecting and excitation fibers allow for system adjustment and repair.
- Raman filter packs can be configured for cut-on wavenumbers ranging from 65 to 200 cm-1.
- Configurable probe tips for lab and immersion applications

Image Credit: m-oem
A few details about these configurable settings are provided below.
Configurable Working Distance
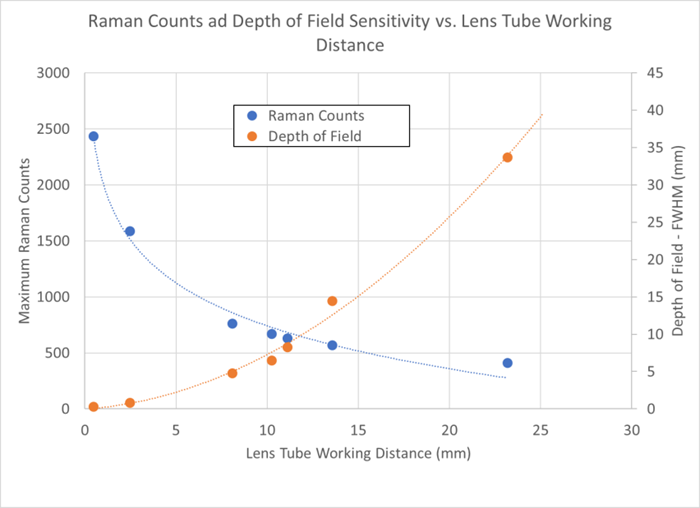
The lens tube optic focal length can be adjusted to control the depth of field and operating distance of the probe [Figs. 1, 2].

Figure 1. Sensitivity of relative Raman counts versus probe distance for different lens tube optic focal lengths. Image Credit: m-oem

Figure 2. Sensitivity of maximum Raman counts and depth of field (full-width half maximum) versus lens tube working distance. Image Credit: m-oem
Configurable Excitation Spot Size
As illustrated in Figure 3, the focused excitation spot size (h2) can be tailored by individually selecting the laser excitation fiber diameter (h1), the focal length of the excitation collimator (f1), and the focal length of the lens tube optic (f3).

Figure 3. Magnification of the input spot size by selection of different focal length lens of the input excitation collimator (f1) and the focal length of the lens tube optic (f2). h2 = f2/f1*h1. Image Credit: m-oem
As shown in Figure 3, there are several things you may do to vary the spot size (h2), each with advantages and disadvantages:
- Reducing f2 (lens tube focal length): Reduces h2 but also decreases the depth of field and may be limited by system limits.
- Reducing h1: Reduce h1 to reduce h2, but consider restricting power coupled into the fiber if the laser diode near field emission width exceeds h1.
- Increasing f1 (focal length of the excitation collimator): Maximize power at the sample by matching the excitation collimator's numerical aperture to the source's numerical aperture (NA). Increasing f1 or decreasing the NA below the NA of the excitation fiber results in less light in the collimated beam and reduced power at the sample.
Figure 4 shows the excitation spot size sensitivity as a function of excitation collimator numerical aperture and lens tube focal length for a core excitation fiber with a diameter of 105 (h1).

Figure 4. Excitation spot size vs. excitation collimator NA for various lens tube focusing lens and a 105 um-diameter core excitation fiber. Image Credit: m-oem