HAPPY ST. PATRICK’S DAY! St. Patrick’s Day (March 17th) has been popularized worldwide as a time to celebrate by wearing green, drinking beer, and going to see one of the hundreds of parades. St. Patrick has been credited with bringing the Christian religion to the Irish people even though he was kidnapped and enslaved for years in Ireland at a young age [1].

Image Credit: B&WTek
Drinking Irish beer is a customary way to celebrate the day. Because the holiday falls during the Christian practice of Lent, it was a break in the period of abstinence where meat and alcohol could be enjoyed [1]. Additionally, beer has been made and consumed by Celtic people for thousands of years [2]. Over the more recent centuries, St. Patrick’s Day has developed into the mainstream celebration it is today.
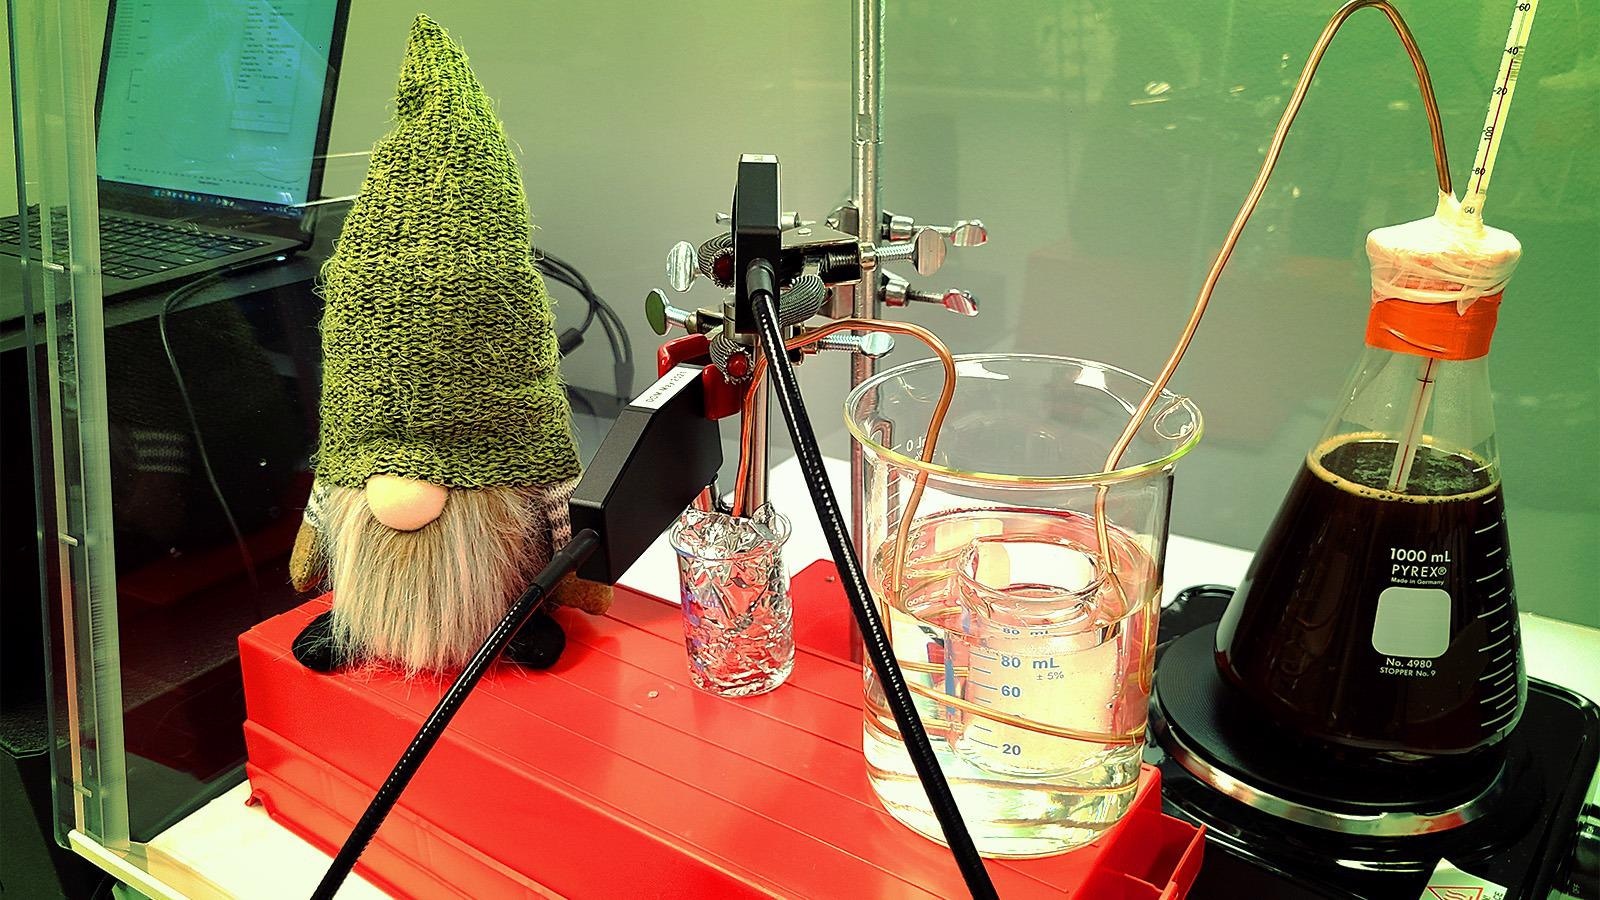
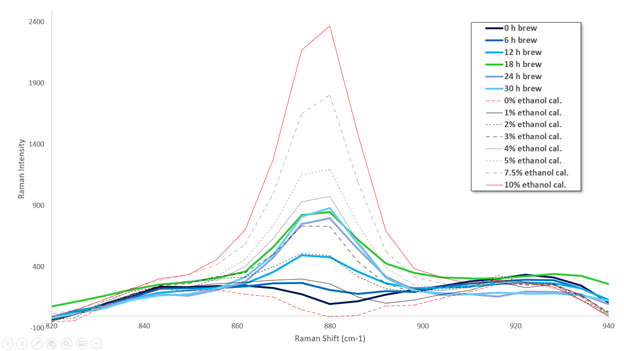
In honor of the holiday, an Irish stout was brewed at the Application Lab at B&W Tek. Over the course of two weeks, sugar from the added malt is converted to ethanol by yeast in anaerobic conditions. The ethanol production from the fermentation process was monitored in real-time using an i-Raman EX, a-1064-nm laser portable instrument, equipped with a BAC100B-HT high-throughput research grade probe with RIS101 Sapphire Ball Immersion shaft. BWSpec software was setup to monitor the symmetric C-C stretching mode specific to ethanol (880 cm-1, Figure 1) [3] of the fermenting beer every 20 min., using the Peak Monitor and Timeline function, until the fermentation process was finished.

Figure 1. Raman spectrum of the C-C band of ethanol in 0%, 1%, 2%, 3%, 4%, 5%, 7.5%, 10.0% ethanol calibration sample (for reference) and Irish stout after 0, 6, 12, 18 ,24, and 30 hr brewing.
Image Credit: B&WTek
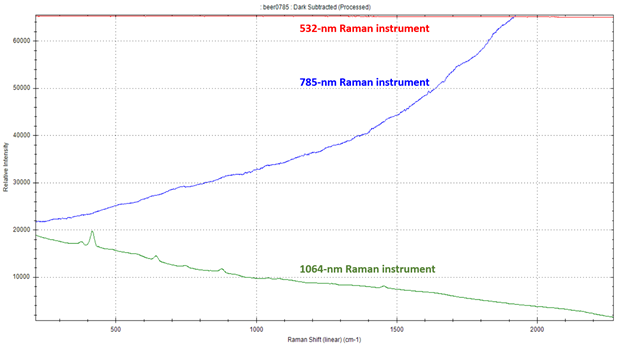
The Irish stout presented an obstacle for Raman because it is a very dark brown color, which typically indicates it will produce fluorescence. A 1064-nm laser system can be used in a situation like this to minimize fluorescence effects to obtain a Raman spectrum with clear peaks and features. Alternative systems that use 532-nm or 785-nm lasers were unable to distinguish ethanol peaks in the calibration sample (Figure 2). With the i-Raman EX, it was possible to actively monitor bioprocess occurring inside the fermenter in real-time. The Raman measurements can be used to determine the quality of the final product before completion and to develop / modify existing processes.

Figure 2. Raman spectra of the Irish stout with 532-nm (red line) 785-nm (blue line) and 1064-nm (green line) Raman instruments.
Image Credit: B&WTek
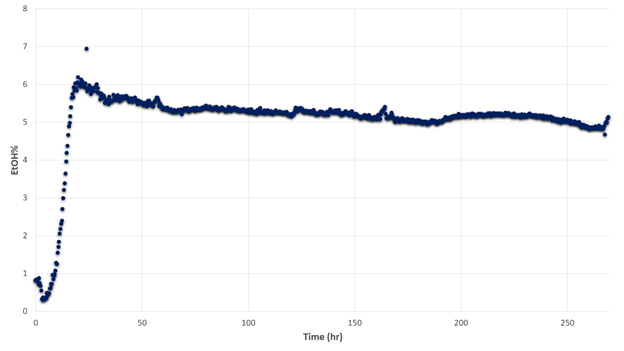
BWIQ chemometric software was used to develop a quantitative model for the ethanol content. Based on the analysis, it can be seen that the majority of ethanol was produced in the first 1000 minutes (16.7 hours), then reached a plateau where the brewer’s yeast had consumed most of the sugars from the solution. The final ethanol content of this Irish Stout is calculated to be approximately 5.1% (Figure 3).

Figure 3. Predicted ethanol concentration of the Irish Stout over 270hr brewing process.
Image Credit: B&WTek
For any curious beer makers out there, we used chocolate, black malt, and caramel 80 grains, Goldings hops, dark dry malt extract, and US-05 yeast.
Have a happy and safe St. Patrick’s Day. For more information about B&W Tek’s Raman systems, visit https://bwtek.com/technology/raman.
[1] History.com Editors. History of St. Patrick’s Day https://www.history.com/topics/st-patricks-day/history-of-st-patricks-day (accessed 2022 -03 -02).
[2] Meussdoerffer, F. G. A Comprehensive History of Beer Brewing. In Handbook of Brewing; Elinger, H. M., Ed.; Wiley-VCH Verlag GmbH & Co. KGaA: Weinheim, Germany, 2009; pp 1–42. https://doi.org/10.1002/9783527623488.ch1.
[3] Picard, A.; Daniel, I.; Montagnac, G.; Oger, P. In Situ Monitoring of Alcohol Fermentation by Saccharomyces Cerevisiae under High Pressure by Quantitative Raman Spectroscopy. Extremophiles 2007, 11, 445–452.