Sponsored by AdmesyJun 18 2015
Sources that emit light experience flicker, which is a frequency domain effect that can cause discomfort or health issues for both animals and humans. In some cases, the lifespan of a device can be reduced due to flicker.
Image Credit: Thanakit Jitkasem/Shutterstock.com
Headaches, fatigue, distraction, reduced visual task performance, apparent slowing or stopping of motion, blurred vision, eyestrain, and neurological problems, including epileptic seizure, are some of the possible effects of flicker on human beings.
Flicker measurements are widely adopted in the lighting and display industry. This article focuses on flicker measurements of LED and SSL products, which show flicker more than fluorescent tubes or incandescent lighting because of their fast response. Fluctuations in mains or power supplies/drivers are the main cause of flicker. The increasing applications of LED and SSL products and drivers necessitate the quality assessment of parameters such as flicker to address health concerns.
Lighting Flicker Percentage and Flicker Index
Light Source Examples
Lighting is powered either by a power supply or directly from the mains power. The power supply can be the original source of flicker, and the effect of flicker can be greater if the light source responds more rapidly to power changes.
The response of the light source is slow for incandescent lamps (Figure 1) and fluorescent light sources (Figure 2), and therefore they have a reduced flicker effect.
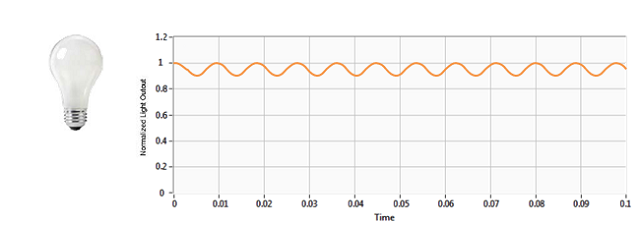
Figure 1. Incandescent lamp: flicker percentage 5.1%, flicker index 0.01. Image Credit: Admesy
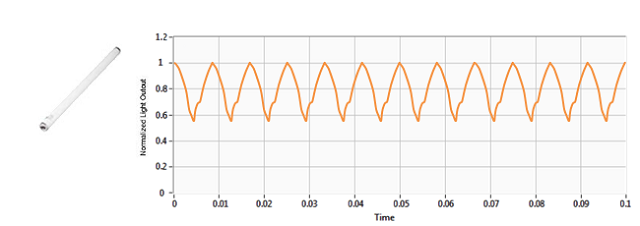
Figure 2. Magnetically ballasted-fluorescent tube: flicker percentage 28.4%, flicker index 0.07. Image Credit: Admesy
Typical examples of light sources and their flicker percentages and flicker index are illustrated in Figures 1 to 4. Figure 4 presents the results for LED lighting, showing higher flicker effect due to its fast response to the power supply changes.
In an ideal situation, a DC current would drive LEDs, but this is not available from the main power source. Therefore, expensive electronics components are required.
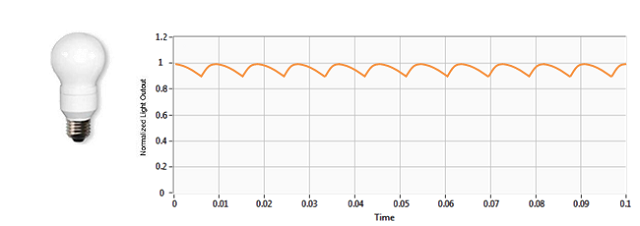
Figure 3. CFL lamp: flicker percentage 5.1%, flicker index 0.01. Image Credit: Admesy
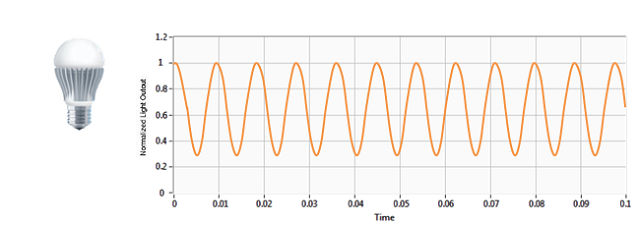
Figure 4. LED lamp: flicker percentage 54.7%, flicker index 0.17. Image Credit: Admesy
Percentage Flicker and Flicker Index Definition
Fluctuations in light output are generally described in terms of percentage flicker (Equation 1) and flicker index (Equation 2). These values are usually given as a value over one cycle of the signal, without considering frequency as component. An example of one cycle of an LED output is presented in Figure 5 to explain both metrics.
 (1)
(1)
 (2)
(2)
Percent flicker uses a 0-100% scale, which is its key advantage. In literature, it is also referred to as Michelson contrast or peak-to-peak contrast. A 0-1.0 scale is used for flicker index. The percent flicker method is more commonly used than the flicker index method.
Both methods use the analysis of one cycle of the periodic waveform, and do not take into account any frequency component. Figure 5 illustrates the method of deriving percent flicker and the flicker index based on capturing one cycle of the optical signal. Flicker index and percentage example is depicted in Figure 6.
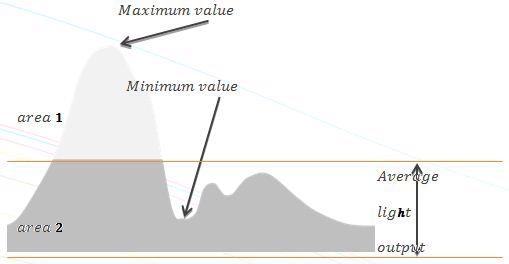
Figure 5. Example of one light fluctuating cycle and relations of flicker. Image Credit: Admesy
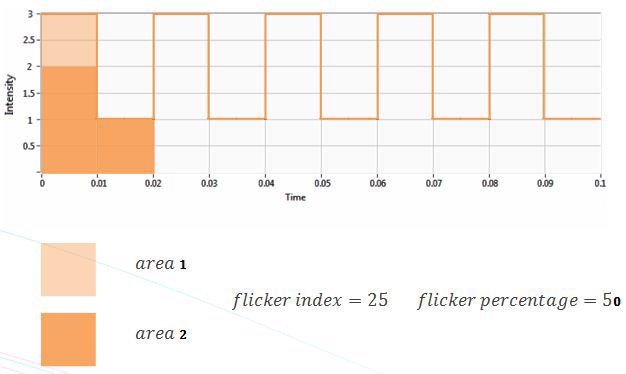
Figure 6. Flicker index and percentage example. Image Credit: Admesy
Measurement Devices
Both high frequency flicker or stroboscopic effects and low frequency flicker can be differentiated in lighting applications. A human vision corrected sensor (CIE1931 luminance response) is normally employed for flicker measurements, using a correct acceptance angle. The sensor must look at the light source in the same way that the human eye does in order to obtain a flicker measurement result that is in correlation with what the eye sees and perceives.
It is possible to perform flicker measurements using a high speed (il)luminance measurement device, or, for instance, a colorimeter, based on the implementation of the measurement devices and samples being tested. The application of an Asteria light meter and Cronus, which is a combination of spectro- and colorimeter, is discussed in this article. The Asteria light meter can measure a maximum of 180.000 luminance samples per second.
Flicker Measurement Procedure [Detector]
For flicker measurements, the most basic setup includes a human vision corrected sensor (CIE1931 luminance response) like the Asteria light meter from Admesy. The sample to be analyzed is placed in front of the detector, and the Admesy Iliad software performs the measurement immediately.
The straightforward method of measuring flicker of light sources using a single device is shown in Figure 7. The influence of ambient lighting and the alignment of device and object being analyzed are considered, leading to achieve repeatable and reliable measurement results. The measurement results will be influenced by flickering from ambient lighting.
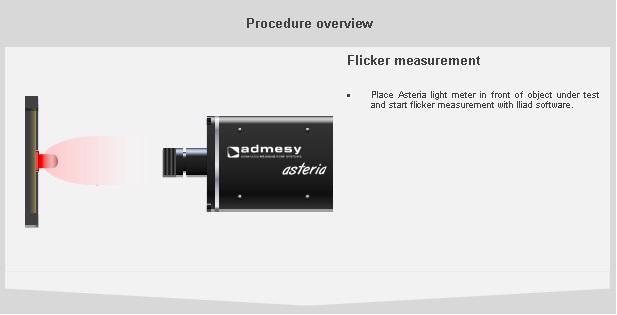
Figure 7. Asteria light meter placed in front of object under test. Image Credit: Admesy
Flicker Measurement Procedure [Integrating Sphere]
An integrating sphere is used to spatially distribute the unidirectional radiation from the LED into homogeneous radiation for applications that demand a combination measurement caption of the total amount of radiant power and flicker. An appropriate sphere size needs to be selected based on the properties of the LED. The light distribution of large spheres is better than that of small spheres because of the relatively small geometrical errors that objects in the sphere can cause.
However, high throughput is one key advantage of small spheres, giving rise to an increased signal-noise ratio. A Cronus spectro-colorimeter is coupled to the sphere using a fiber to carry out both radiant power and flicker measurements using the same setup (Figure 8).
Integrating spheres also eliminate ambient lighting that has an influence on flicker measurements. A fiber coupled to the Asteria also enables single flicker measurements to be performed with integrating spheres.
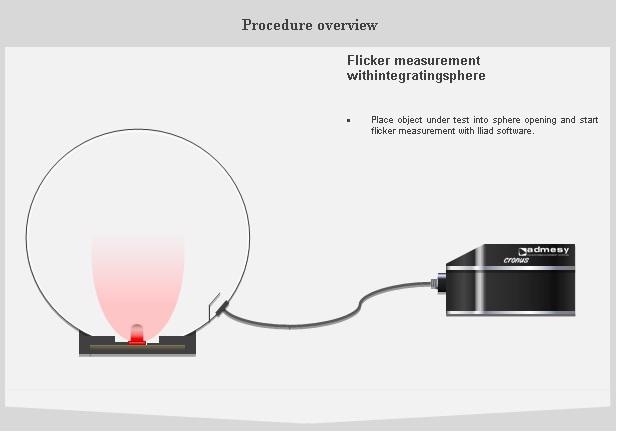
Figure 8. Cronus spectro-colorimeter connected to an integrating sphere. Image Credit: Admesy
Remarks for Measurement Procedure
The following aspects need to be considered before performing flicker measurements and when performing repeated measurements afterwards in order to obtain accurate and repeatable measurements:
- Control calibration (date) of measurement device
- Control ambient lighting to avoid the interference of flicker caused by other light sources with object being analyzed
- Control alignment (in case of standard setup) to ensure that the position of the light source being tested and measurement device is similar for each measurement
- Control sphere for dust and dirt (in case of sphere setup) in order to obtain reliable radiant power measurements
- Control power supplies (current, voltage, AC/ DC, waveform) as these can be a root cause for flicker, and changes in the power supply may have an influence on the measurement results during comparison
- Control or consider stabilization time of the object being tested, as drivers may respond in different ways over time
- Control ambient temperature and humidity of test environment (typical ambient temperature of 25ºC unless otherwise specified)
- Control measurement parameters, such as sample rate, as too slow sample rates may lead to erroneous results

This information has been sourced, reviewed and adapted from materials provided by Admesy.
For more information on this source, please visit Admesy.